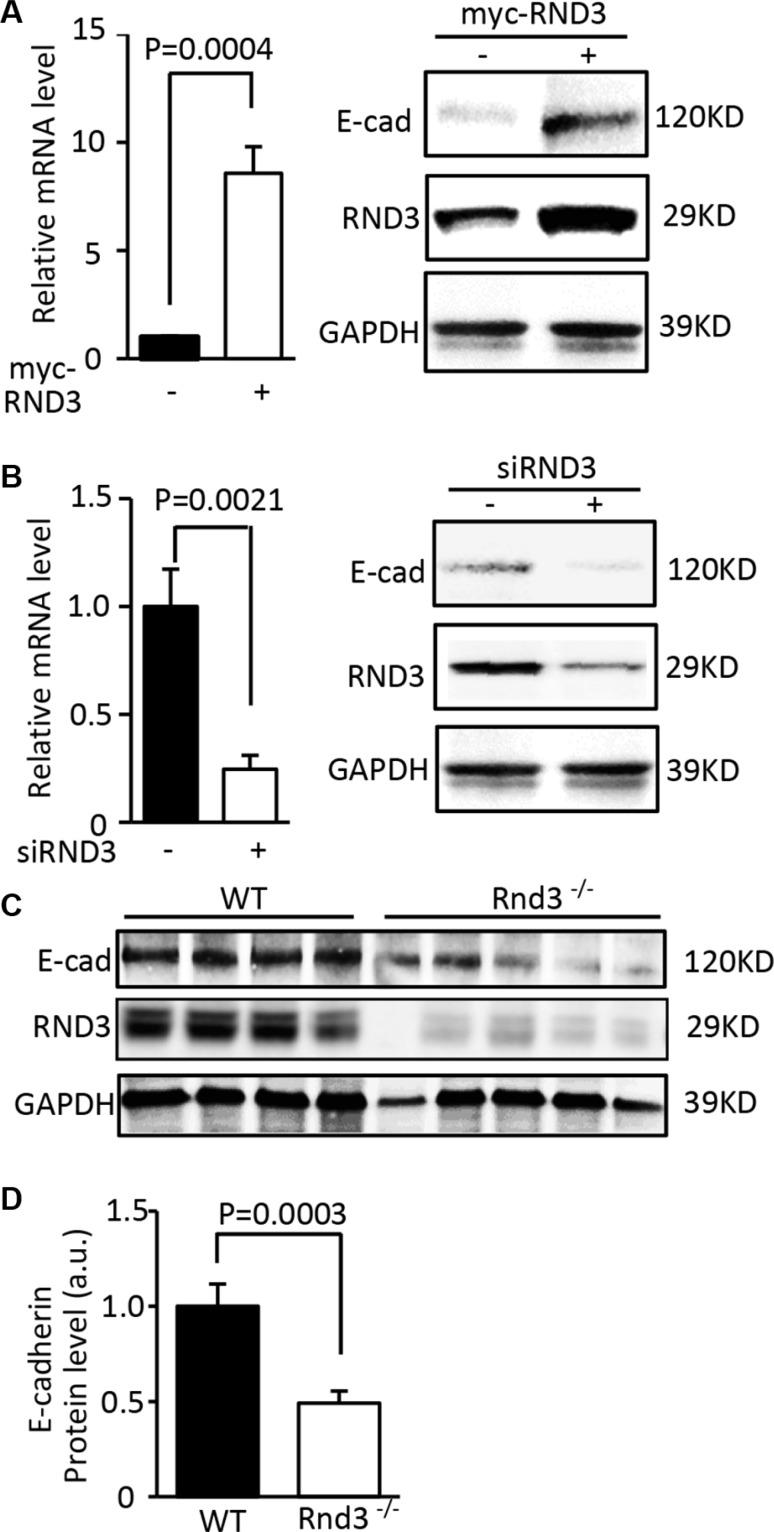
Figure 3. Expression of E-cadherin was closely regulated by RND3.
(A) Forced expression of RND 3 upregulated EMT marker E-cadherin transcript (left panel) and protein levels (right panel) in U251 cells. (B) Knockdown of RND 3 resulted in inhibition of E-cadherin transcript (left panel) and protein levels (right panel) in U251 cells. (C) Protein expression level of E-cadherin was significantly decreased in Rnd3-null mouse brain tissues compared to the WT control mice. (D) This downregulation was quantified. Student's t test was used.

