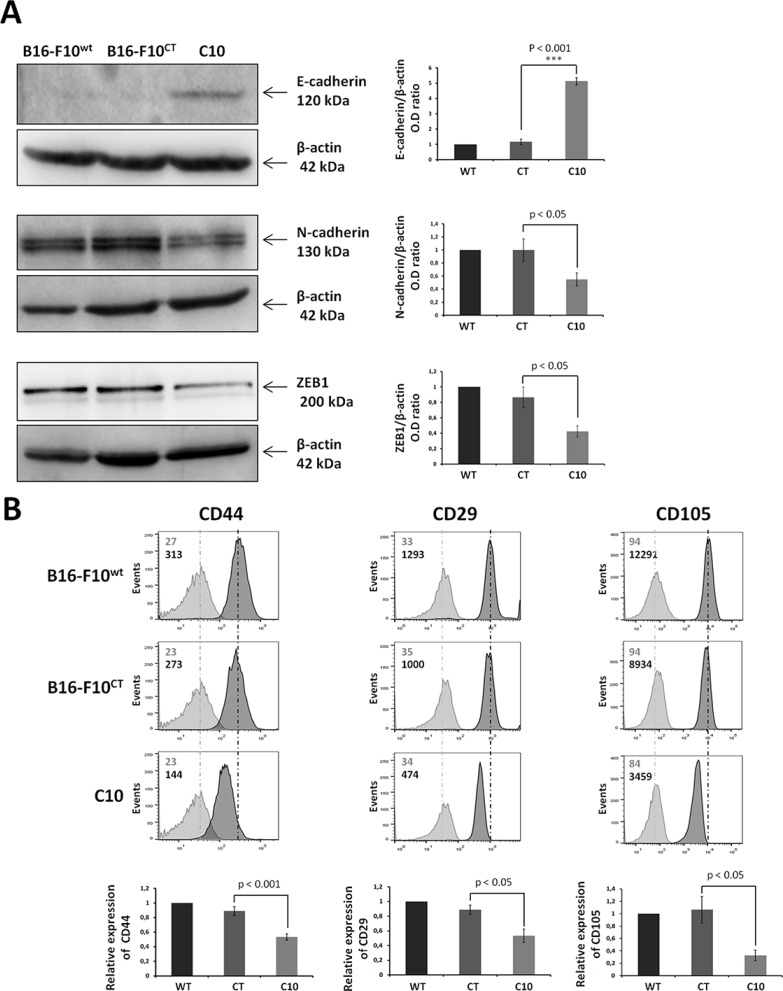
Figure 3. IGF-1 downregulation promotes mesenchymal-to-epithelial transition.
(A) Western blot analysis of an epithelial marker (E-cadherin), a mesenchymal marker (N-cadherin), and an EMT regulator (ZEB1) in C10, B16-F10CT and B16-F10WT cells. β-actin was used as the loading control. Graphs represent the quantification of the immunoblot signals corresponding to the protein of interest/β-actin ratio. Data are represented as means ± SEM for three independent determinations, p < 0.05, p < 0.001 versus B16-F10CT cells. (B) Flow cytometry analysis of surface expression of the mesenchymal markers CD44, CD29 and CD105. The dark-colored bars correspond to cells incubated with the antigen-specific antibody, and gray bars correspond to cells incubated with the isotype-matched control antibody. Mean fluorescence intensity values for each marker are shown at the top left of each histogram. Each panel corresponds to three independent experiments with similar results, p < 0.05, p < 0.001 versus B16-F10CT cells.

