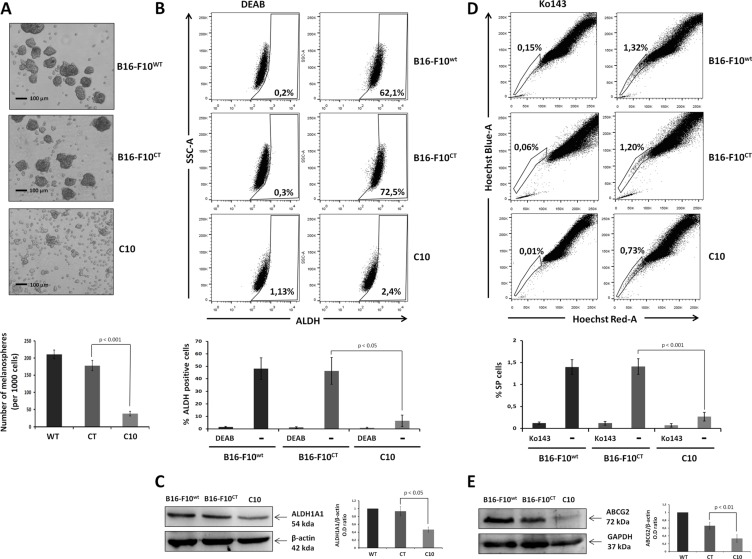
Figure 6. IGF-1 knockdown affects stemness properties and MIC behavior.
(A) Melanosphere formation assay. We assessed the ability of parental B16-F10 cells to produce tumor spheres, by suspending 1x10³ cells in a serum-free medium and incubating them at 37°C for 7 days. The total number of spheres produced was compared between groups. The scale bar represents 50 μm. Top, Independent experiments were performed three times and a representative experiment is shown. Bottom, Data are shown as means ± SEM. The melanospheres for the IGF-1-knockdown clone (C10) were significantly smaller and fewer (38.3 ± 6.7 spheres per 1000 cells) than those formed by B16-F10WT (210.6 ± 12.9 spheres per 1000 cells) and B16-F10CT(178.3 ± 14.6 spheres per 1000 cells, p < 0.001, n = 3) cells. (B) ALDH activity. ALDH1A1 activity was analyzed in B16-F10WT, B16-F10CT and C10 cells, by flow cytometry with the Aldefluor reagent kit. ALDH1A1 activity was normalized by taking measurements in the presence and absence of the ALDH1-specific inhibitor, diethylamino-benzaldehyde (DEAB: 10 μM). The top panel depicts one of four experiments. The percentage ALDH-positive cells is shown at the bottom right of each histogram. Bottom, Data are shown as means ± SEM. ALDH activity was much weaker in C10 clones (6.5 ± 9.2%) than in B16-F10WT and B16-F10CT cells, which had high levels of ALDH activity (48.2 ± 19.2% and 46.4 ± 23.9%, p < 0.05, n=4 respectively). (C) ALDH1A1 protein levels, as determined by immunoblotting. β-actin was used as the loading control. Graphs represent the quantification of immunoblot signals, corresponding to the ALDH1A1/β-actin ratio. The data shown are the means ± SEM of three independent determinations, p < 0.05. (D) Side population (SP) analysis. C10, B16-F10CT and B16-F10WT cells were stained with Hoechst 33342 dye in the presence and absence of Ko143 (1 μM), and the SP was analyzed by flow cytometry. Top, Data from at least five independent experiments with similar results. Percentages of SP cells are shown at the top left of each histogram. Bottom, Data are shown as means ± SEM. SP cells represent 1.4 ± 0.4% of all cells for B16-F10WT and B16-F10CT cells, but only 0.3 ± 0.2% of total C10 clone cells (p < 0.01, n = 5). (E) Analysis of ABCG2 expression in cell lysates of C10, B16-F10CT and B16-F10WT. β-actin was used as the loading control. Top, Figures are representative of three independent experiments yielding similar results. Bottom, Data are shown as means ± SEM, p < 0.01 versus B16-F10CT cells.

