
Figure 4. SHG imaging quantification comparing patients with progression to muscle-invasive disease versus those with no progression.
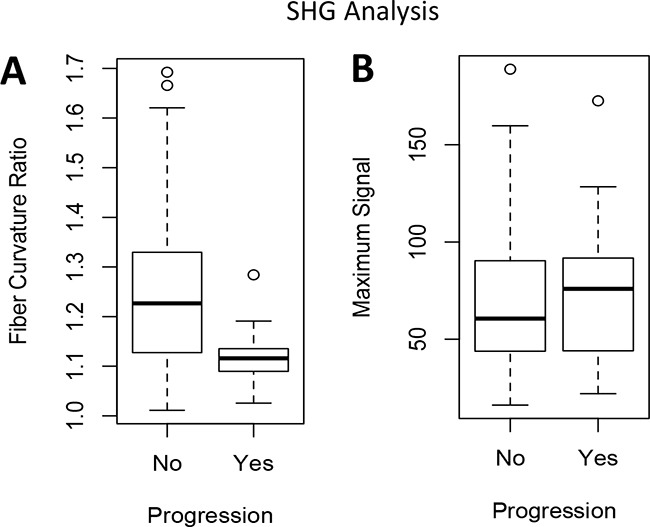
Wilcoxon rank sum was used to compare measurements between patients with and without progression. (A) Median fiber curvature ratio P = 0.0018 (B) Maximum SHG signal P = 0.652.