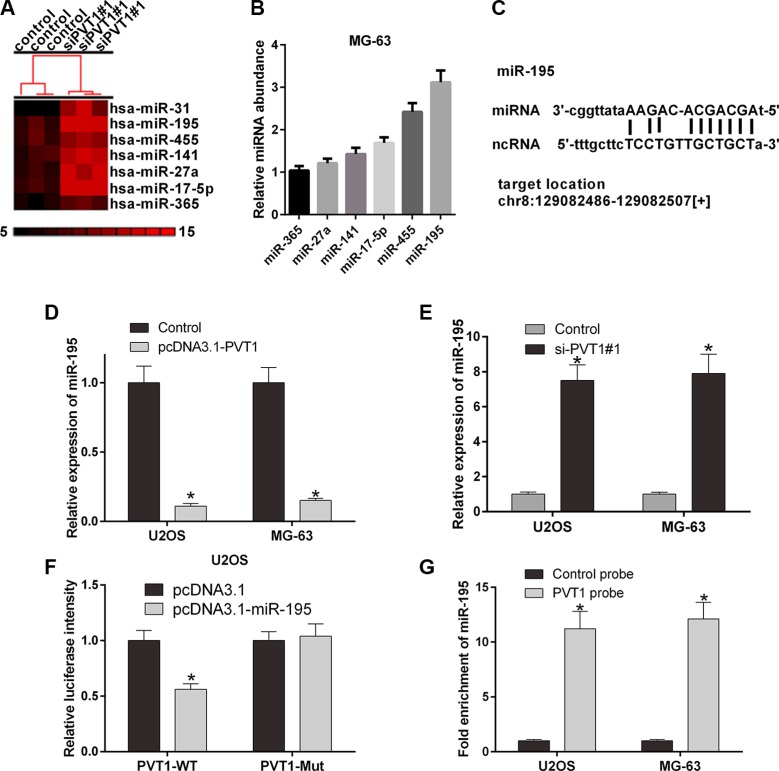
Figure 4. PVT1 negatively regulates miR-195 in osteosarcoma cells.
(A) The cluster heat map of differentially expressed miRNAs in U2OS cells transfected with control or si-PVT1#1 on a scale from black (low) to red (high). Individual cell subsets are depicted as columns. (B) qRT-PCR was used to measure the mRNA expression level of PVT1 in MG-63 cells transfected with the predicted miRNAs, i.e., miR-365, miR-27a, miR-141, miR-17-5p, miR-455, or miR-195. (C) The putative binding site of miR-195 and LncRNA PVT1 is shown. (D) The mRNA expression level of miR-195 was analyzed by qRT-PCR in U2OS and MG-63 cells transfected with control or pcDNA3.1- PVT1 (*P < 0.05). (E) The mRNA expression level of miR-195 was analyzed by qRT-PCR in U2OS and MG-63 cells transfected with control or si-PVT1#1 (*P < 0.05). (F) The luciferase activity of PVT1 was detected using the luciferase report gene assay in U2OS cells co-transfected the wild type (PVT1-WT) or mutant (PVT1-Mut) and pcDNA3.1 or pcDNA3.1-miR-195 (*P < 0.05). (G) miR-195 was significantly enriched by a chromatin Immunoprecipitation (ChIP) assay in U2OS and MG-63 cells transfected with control or PVT1 probe (*P < 0.05).

