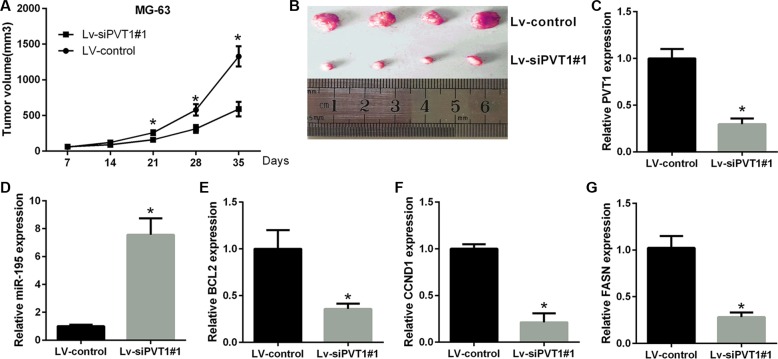
Figure 7. PVT1 promotes tumor growth in vivo.
(A) Statistical analysis of changes in tumor volume in vivo. (B) Representative image of tumor formation in nude mice 35 days after the subcutaneous administration of Lv-shRNA-PVT1#1 and Lv-control cells. (C–G) The results of qRT-PCR analyses for PVT1, miR-195, BCL2, CCND1 and FASN after PVT1 silencing in vivo (**P < 0.05).

