
Figure 2. Expression of PTEN, PIK3C2A, ITPA and BCL3 in ccRCC and their relationship with OS and DFS.
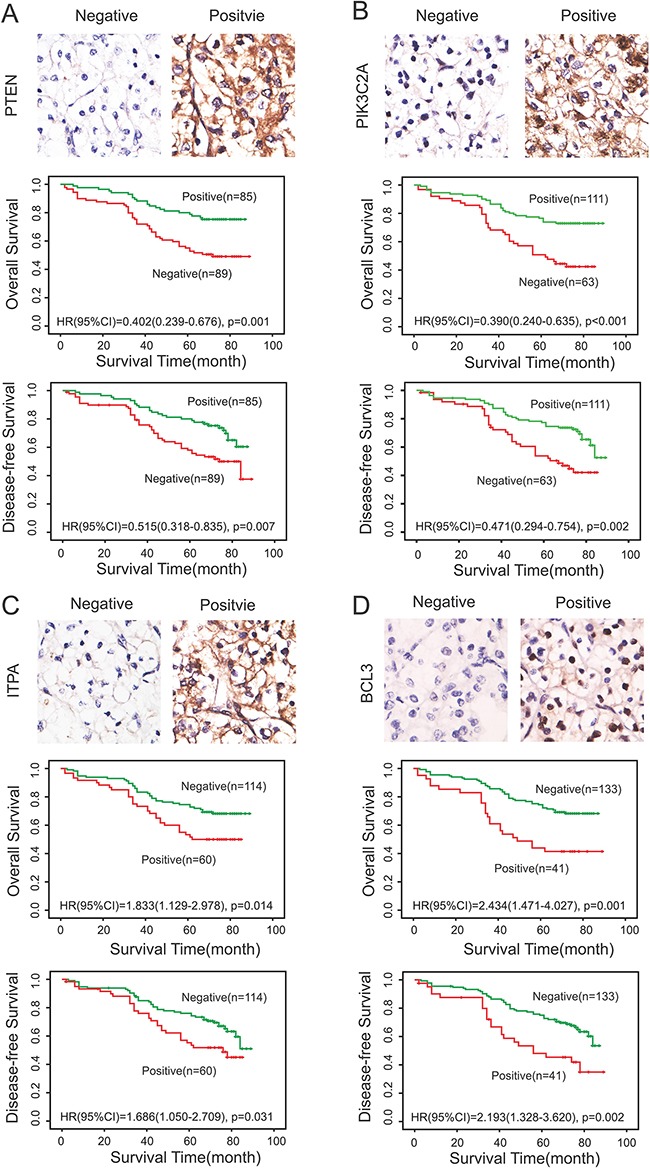
IHC analysis on tissue microarrays and Kaplan-Meier survival curves were constructed to verify the relationship between PTEN A., PIK3C2A B., ITPA C. and BCL3 D. expression with regard to OS and DFS. (A, B) Negative expression of PTEN and PIK3C2A were correlated with shorter OS and DFS time and worse prognosis. (C, D) Positive expression of ITPA and BCL3 were correlated with shorter OS and DFS time and worse prognosis. Green and blue lines indicated positive and negative expression groups, respectively. P <0.05 was considered to be statistically significant.