
Figure 4. Prediction of the prognosis of ccRCC patients by the four-gene signature on tissue microarrays.
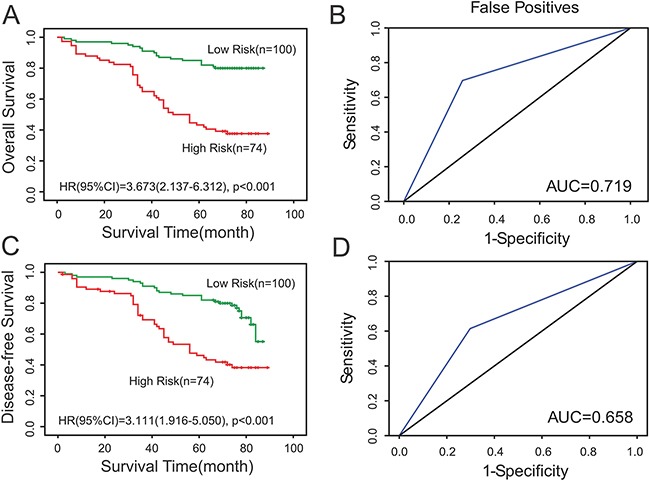
A, C. Kaplan-Meier survival curves indicated shorter DFS and overall OS time for the high-risk group (n =74) than in the low-risk group (n =100) (P <0.05). B, D. ROC analysis was performed to compare the sensitivity and specificity of the models. P <0.05 was considered to be statistically significant.