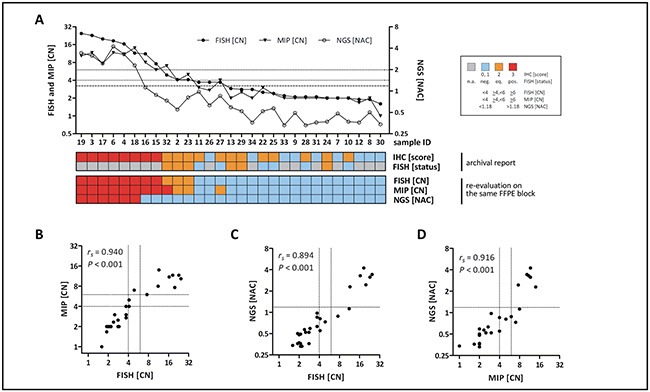
Figure 2. HER2/ERBB2 CN detection by three methods (FISH, MIP, NGS/NAC).

A. Diagrammatic representation of all cases ordered by FISH-based CN. Dotted lines indicate thresholds implemented for FISH and MIP. The dashed line indicates the threshold implemented fro NGS/NAC. B. Correlation of HER2/ERBB2 CN values obtained by FISH and MIP C. Correlation of HER2/ERBB2 CN values obtained by FISH and NGS/NAC D. Correlation of HER2/ERBB2 CN values obtained by MIP and NGS/NAC. Dotted lines indicate thresholds used to classify HER2 as negative, positive or equivocal.
