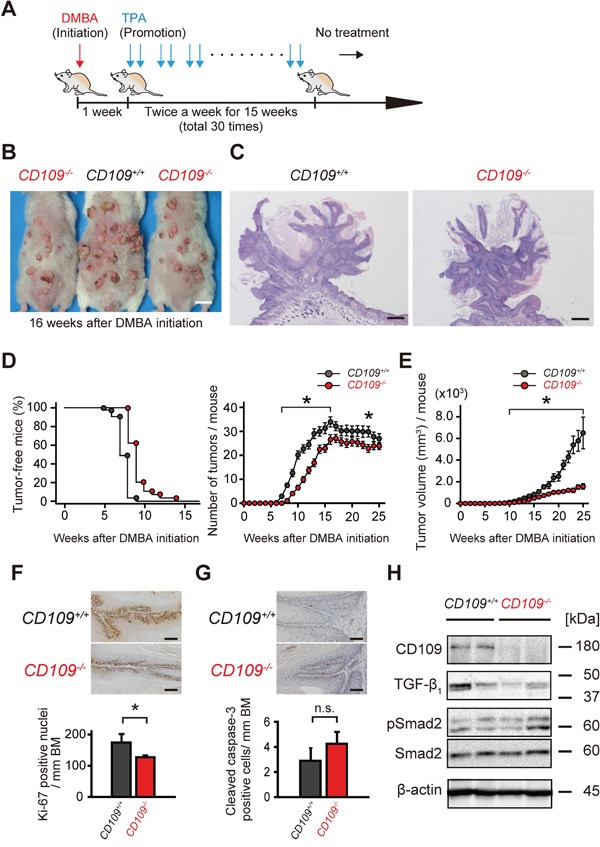
Figure 3. DMBA/TPA-induced skin tumorigenesis was suppressed in CD109−/− mice.

A. Schematic diagram of the two-stage chemical carcinogenesis protocol in mouse skin. B. Representative macroscopic images of CD109+/+ and CD109−/− mice at 16 weeks after DMBA initiation. Scale bars, 1 cm. C. Representative histological images of papillomas isolated from CD109+/+ and CD109−/− mice at 17 weeks after DMBA initiation. Scale bars, 500 μm. D. Percentage of tumor-free mice (left) and average number of tumors per mouse (right) during DMBA/TPA tumorigenesis (27 mice in the CD109+/+ group and 22 mice in the CD109−/− group). E. Tumor volume was significantly decreased in CD109−/− mice compared with in CD109+/+ mice 10–25 weeks after DMBA initiation (n = 9 per group). F, G. Immunohistochemical staining for Ki-67 (F) and cleaved caspase-3 (G) in CD109+/+ and CD109−/− papillomas at 17 weeks after DMBA initiation (left). The numbers of positive cells in epidermis were counted per mm of basement membrane (BM) (right, n = 6 per group). Scale bars, 100 μm. H. Immunoblot analysis of CD109+/+ and CD109−/− papilloma lysates prepared at 17 weeks after DMBA initiation, using antibodies against CD109, TGF-β1, pSmad2, and Smad2. β-actin expression is shown as a loading control. TPA, 12-O-tetradecanoylphorbol-13-acetate; n.s., not significant; *P < 0.05.
