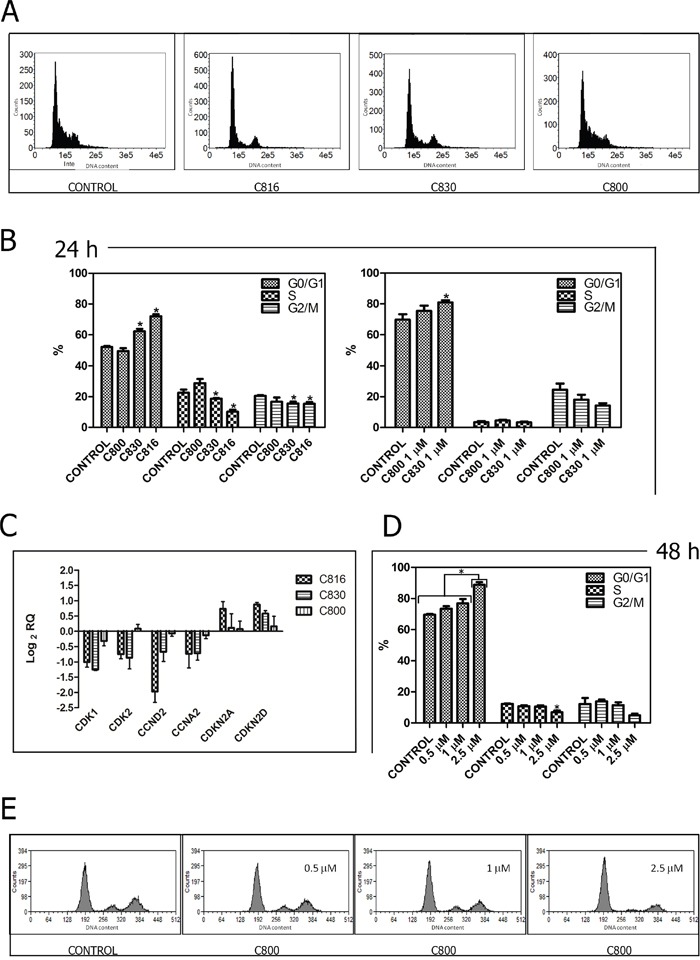
Figure 3. Crambescidins arrest cell cycle progression in the G0/G1 phase.

A. Representative histograms of the cell cycle obtained after flow cytometry analysis of 2.5 μM C816, C830 and C800-treated HepG2 cells for 24 h. B. Quantification of the cell population percentages in each phase of the cell cycle in control and HepG2 cells treated with 2.5 μM C816, C830, C800 and 1 μM C830 and C800 for 24 h (p <0.05, n =2). C. Down-regulation of CDK1, CDK2, CCND2 and CCNA2 mRNA and up-regulation of CDKN2A and CDKN2D mRNA in 2.5 μM C816, C830 and C800-treated cells after 24 h as determined by qRT-PCR. D. Quantification of the cell population percentages in each phase of the cell cycle in control and HepG2 cells treated with 0.5, 1 and 2.5 μM C800 for 48 h (p <0.05, n =2). E. Representative histograms of the cell cycle obtained after flow cytometry analysis of 0.5, 1 and 2.5 μM C800-treated cells for 48 h.
