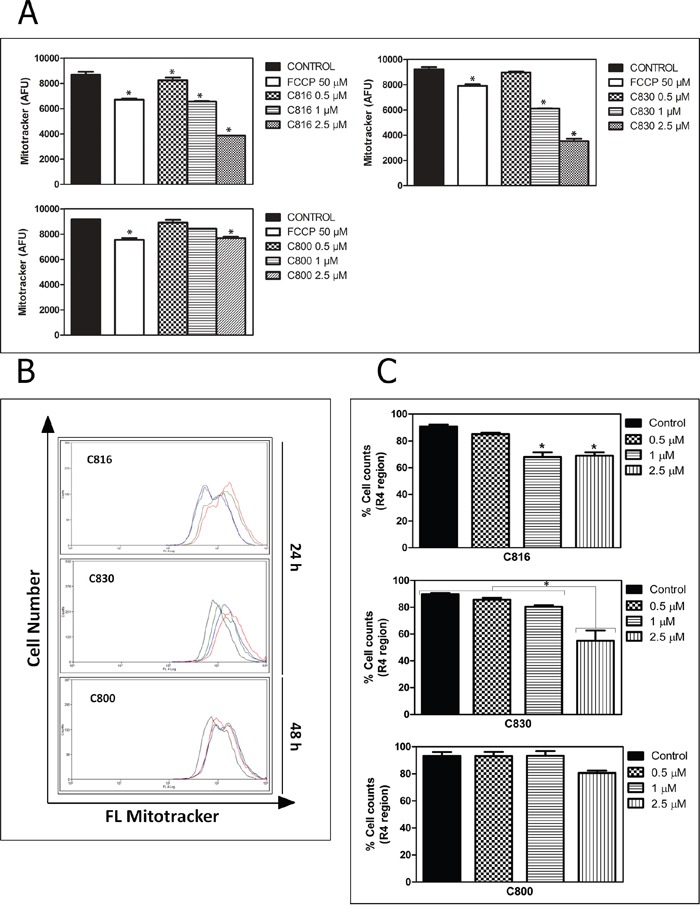
Figure 5. Crambescidins' effect on mitochondrial function.

A. Effects of 0.5, 1 and 2.5 μM C816, C830 and 0.5, 1 and 2.5 μM C800 treatments on mitochondrial membrane potential after 24 and 48 h, respectively as determined using MitoTracker® Red CM-H2XRos staining (p<0.05). B. Representative overlay histograms of mitochondrial viability of control (red line), 0.5 (green line), 1 (blue line) and 2.5 μM (black line) treated cells as determined by flow cytometry using Mito Tracker® Deep Red-FM. C. Population percentages of HepG2 cells (mean ± SEM) in the R regions (for R1, 2, 3 and 4 regions determination see Supplementary Figure S1) after 24 h treatments with C816, C830 and 48 h with C800 (p <0.05).
