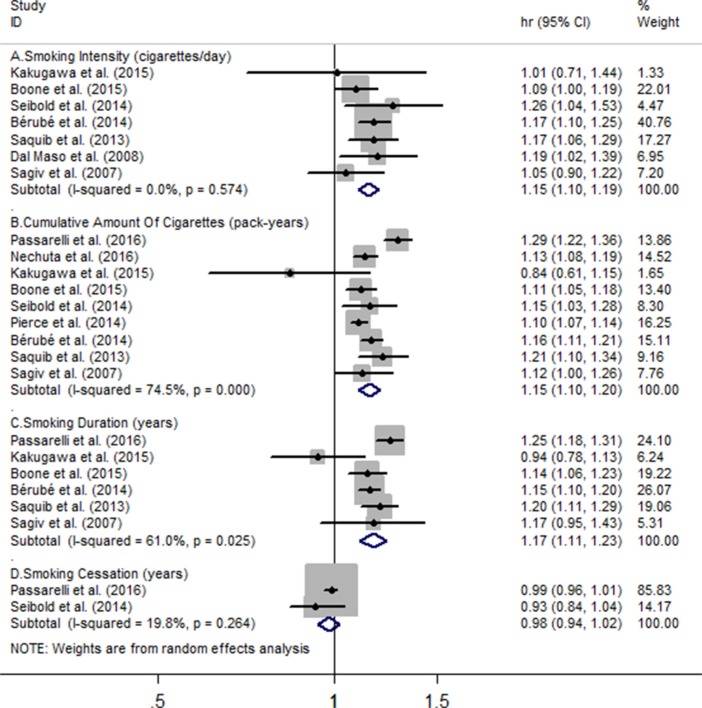
Figure 3.
Meta-analysis on (A) smoking intensity (cigarettes/day), (B) cumulative amount of cigarettes, (C) smoking duration, (D) smoking cessation and the risk of all-cause mortality. The squares represent the hazard ratio per (A)10 cigarettes/day, (B) 10 pack-years, (C-D) 10 years increase for each individual study, with the area reflecting the weight assigned to the study. The horizontal line across each square represents the 95% confidence interval. The diamond represents the summary hazard ratio per (A) 10 cigarettes/day, (B) 10 pack-years, (C-D) 10 years increase in smoking doses or duration, with width representing 95% confidence interval.

