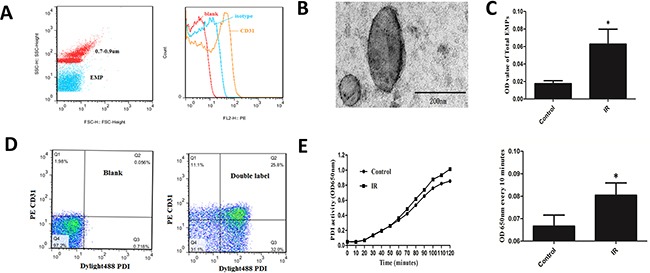
Figure 3. Detection of EMPs quantity and EMP-PDI activity.

A. Define gate of microparticles using standard fluorescent microspheres with 0.7-0.9μm. CD31 represented endothelial cell derivation. B. TEM images of EMPs. Scale bars 200nm. C. ELISA detected the number of EMPs in supernatant of IR and normal HUVEC medium.D. Bicolor flow cytometry confirmed EMP carrying PDI. E. ELISA combined with insulin transhydrogenase assay detected PDI activity of EMPs. *P < 0.05 compared with control. Data are means ± SD from at least three separate experiments.
