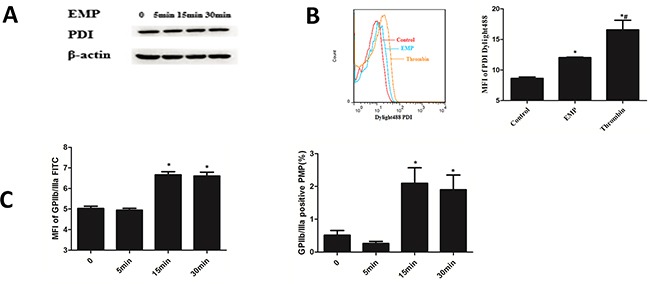
Figure 5. Platelet stimulated by EMPs expressed PDI and released PMPs.

A. Platelets were stimulated with EMPs to detect the platelet PDI expression by Western blotting analysis. B. Stimulate platelet with EMPs and 0.5U thrombin to detect the platelet surface PDI by flow cytometry. Histograms represent MFI of PDI Dylight 488. *P < 0.05 compared with control, #P < 0.05 compared with EMPs treatment. C. Histograms represent MFI and percentage of GPIIb/IIIa in PMPs. *P < 0.05 compared with 0 min. Data are means ± SD from at least three separate experiments.
