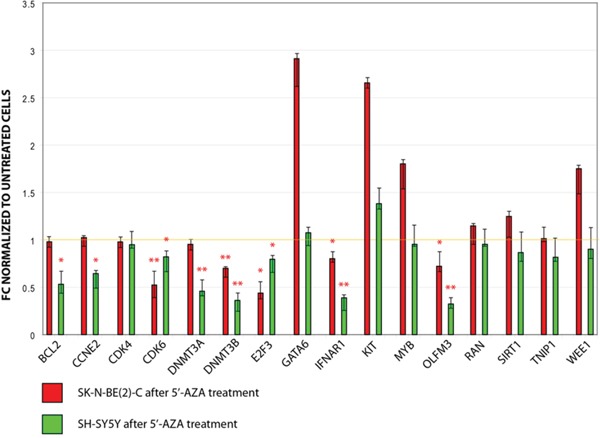
Figure 1. Expression of candidate miRNAs targets in SH-SY5Y and SK-N-BE(2)-C after treatment with 5′-AZA.

Values are reported as fold change (FC) versus untreated cells (controls). * p-value < 0.05; ** p-value < 0.01 (Student's t-test, n = 3).

Values are reported as fold change (FC) versus untreated cells (controls). * p-value < 0.05; ** p-value < 0.01 (Student's t-test, n = 3).