
Figure 3. Detection of somatic ITDs in BCOR.
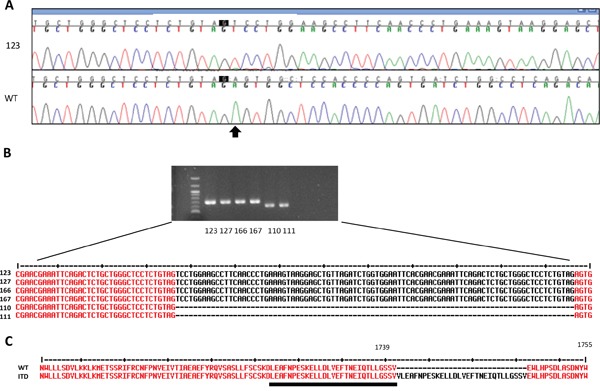
A. The sequence of exon 15 of BCOR was analyzed by Sanger sequencing in the genomic DNA from blood (WT) or from the primary tumor (123). The arrow indicates the start of the ITD. B. RT-PCR showing an aberrant BCOR product in 2 regions of the primary tumor (123,127) and two metastases (166, 167) compared to normal brain (110 and 111). The ITD was confirmed by Sanger sequencing. C. Protein sequence of the ITD and of normal BCOR (WT). The WT region duplicated in the ITD is underlined. The amminoacid positions according to the sequence Q6W2J9-1 (UniProtKb) are indicated.