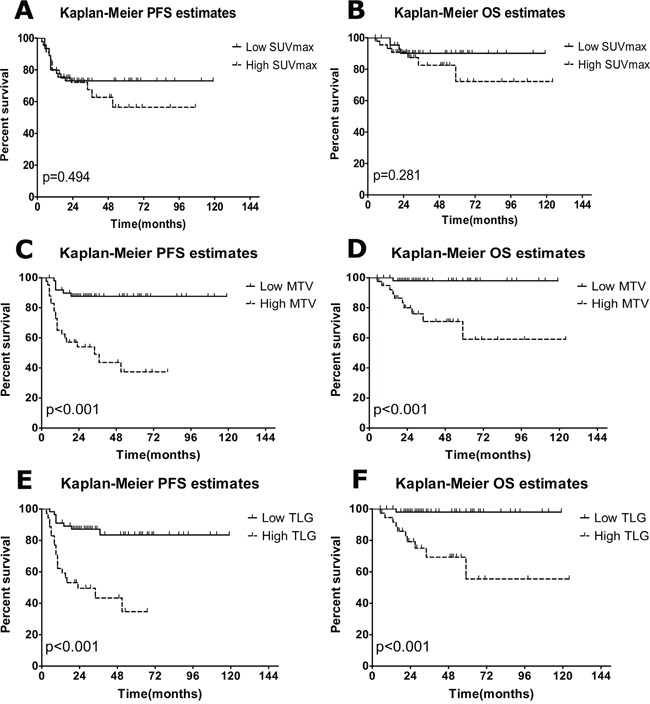
Figure 1. Estimates of PFS and OS according to parameters in baseline PET/CT.

A, C, E. Kaplan-Meier estimates of PFS; B, D., E Kaplan-Meier estimates of OS. High, above the cutoff values from ROC analysis; low, at or below the cutoff values from ROC analysis.
