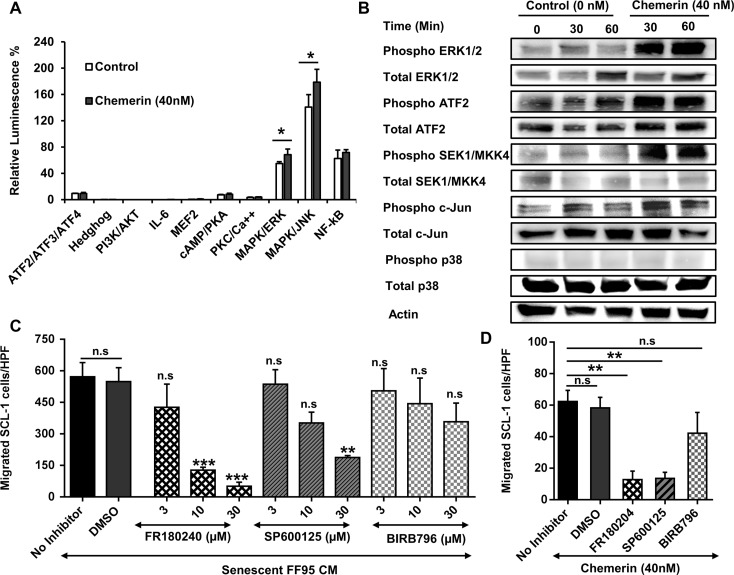
Figure 6. Role of MAPK signaling pathway in the regulation of Chemerin-mediated cell migration.
(A) In order to define the signaling pathway activated by Chemerin, we used a G-protein couple receptor (GPCR) Cignal Finder® Reporter Array consisting of inducible transcription factor response constructs encoding the firefly luciferase reporter gene. SCL-1 cells were transfected with each reporter constructs and further treated with DMEM containing 40 nM rh Chemerin or no Chemerin (control) for 1 hour. The dual-luciferase assay was developed and the results were expressed as the percentage of relative luminescence signal according to the manufacturer's instructions. Results highlighted that Chemerin activates JNK and ERK1/2 MAPK signaling pathway. Shown is a representative of three independent experiments presented as Mean ± S.D (n =3). *p < 0.05 calculated by unpaired student t-test. (Note that due to low standard deviations of some measurements, error bars are not visible for all data points.) (B) To confirm the Cignal Finder® Reporter Array data, SCL-1 cells were cultured in the presence and absence of 40 nM rh Chemerin for 30 and 60 minutes and protein lysates were analyzed by Western blot for phosphorylated and total amounts of MAPK key proteins. (C) We investigated whether inhibition of MAPK pathway dampens the migration of SCL-1 cells stimulated by Chemerin-rich conditioned media of senescent fibroblasts. The graph represents the concentration-dependent inhibition of SCL-1 cell migration in response to senescent fibroblast CM by SP600125 (JNK inhibitor), FR180204 (ERK1/2 inhibitor) and BIRB796 (P38 inhibitor). DMSO served as a vehicle control. Data are presented as Mean ± S.E.M. for 3 independent experiments; *p < 0.05, **p < 0.01 and ***p < 0.001 in comparison to DMSO control calculated by Bonferroni post hoc test after ANOVA; HPF= ×100 magnification (D) Bar graph showing the effect of MAPK inhibitors (10 μM) on Chemerin-mediated SCL-1 cell migration. Data are presented as mean ± S.E.M. for 3 independent experiments; ***p < 0.001 calculated by Bonferroni post hoc test after ANOVA. HPF= ×100 magnification.

