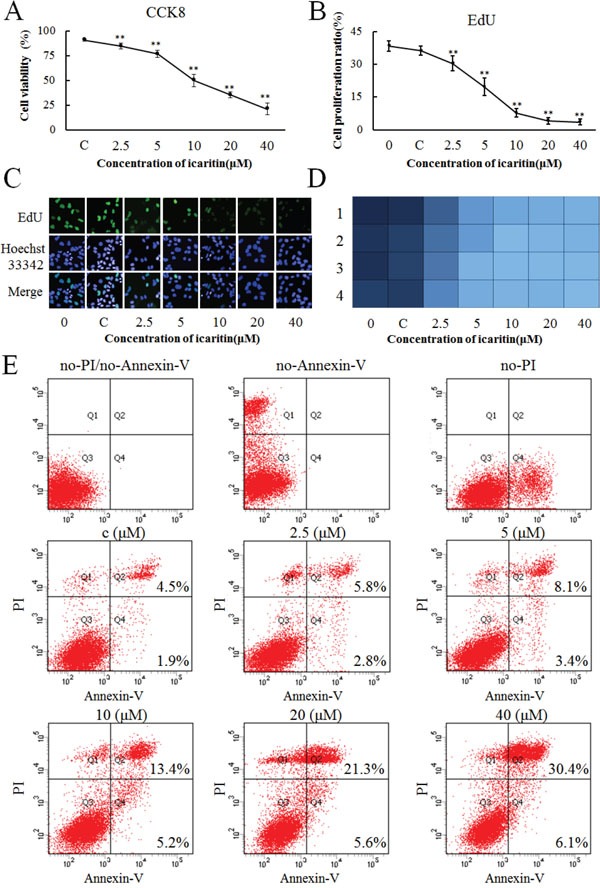
Figure 4. Effects of icaritin on proliferation of PLC/PRF/5 cells.

A. Different concentrations (C, 2.5, 5, 10, 20 and 40 μM/L) of icaritin were tested in cell culture. The viability of PLC/PRF/5 cells was evaluated using a cell counting kit (CCK)-8 assays at 48 h. B. The proliferation of PLC/PRF/5 cells was evaluated by an EdU assays after treatment with different concentrations of icaritin at 48 h. C. Heat map of PLC/PRF/5 cell proliferation after treatment with different concentrations of icaritin at 48 h. A deeper color represents more cell proliferation. D. The proliferation of different concentrations of icaritin-treated PLC/PRF/5 cells captured under a high content imaging system. Proliferating cells are labeled with EdU (Green) and nuclei are stained with Hoechst33342 (Blue). The images are representative of the results obtained. Data are representative of experiments that were repeated three times and are presented as mean ± SD for 6–9 samples. *P < 0.05 and **P < 0.01 as compared with controls. E. The apoptosis of different concertrations of icaritin-treated PLC/PRF/5 cells analyzed by flow cytometry.
