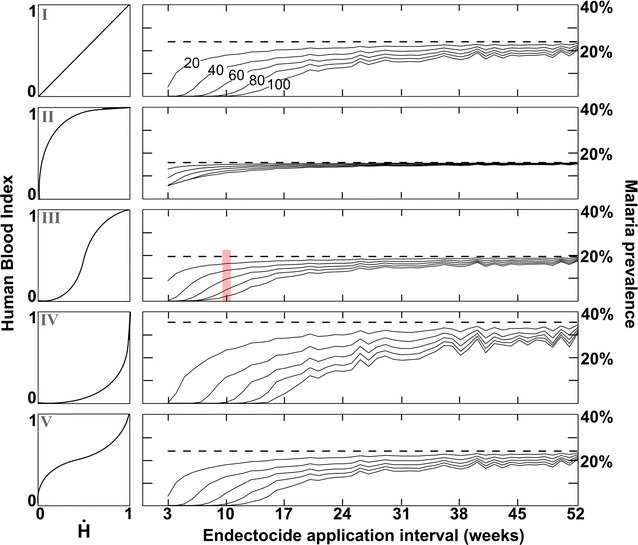
Fig. 3.

Malaria control efficacy as impacted by vector biting ecology and endectocide-treated cattle application frequency. Vector biting ecology is illustrated in the left column. Control levels are shown relative to LLINs alone (dashed lines) for increasing coverage levels of endectocide (solid lines denote 20, 40, 60, 80, and 100% coverage). Prevalence levels correspond with the final peak shown in the temporal dynamics of Fig. 1. Parameter (α,β) values used to produce the different biting Types I–V, respectively, are: 1,1; 0.5,2; 2,2; 2,0.5 and 0.5,0.5. Results are shown above for = 0.5, and for different relative host availability in the Additional file 2. The red stripe shows how these results are related to output in Fig. 2, i.e. the stripe corresponds with the peak infection level just prior to the final control distribution round
