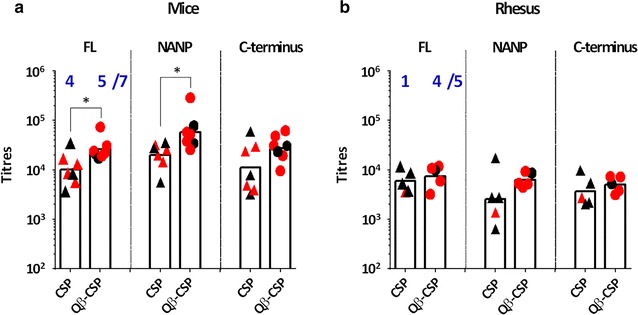
Fig. 6.

Protection efficacy of CSP versus Qβ-CSP vaccination. Individual titres for mice (n = 7) and rhesus (n = 5) 2 weeks post-third vaccination. Red symbols represent (a) mice immunized and protected in direct challenge with 3000 transgenic P. berghei sporozoites (Tr-Pb) or (b) mice protected by challenge with 3000 Tr-Pb in SNA with rhesus serum. Blue numbers represent the number of protected mice out of the total. Bars represent group geometric mean. P values are shown for statistically significant differences between CSP and Qβ-CSP determined by two-tailed t tests
