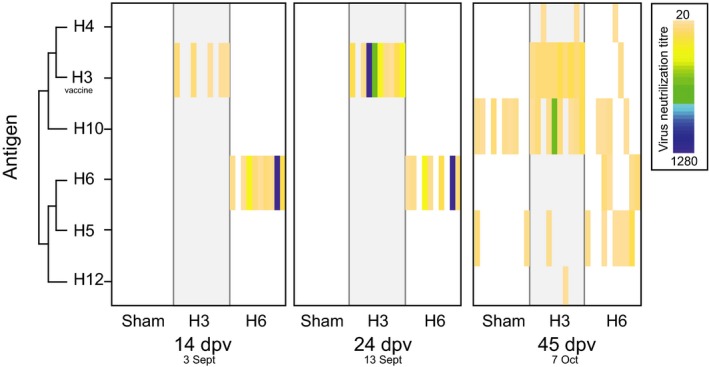
Figure 2.

Development of specific serum antibodies following vaccination (14 dpv), prior to being placed in the duck trap (24 dpv), and following natural infection in the duck trap (45 dpv). Time points are presented as both days postvaccination (dpv), and date in 2013, where birds were placed in the duck trap on 16 September (27 dpv) and the final day in the duck trap was 7 October (45dpv). Each individual is presented as a column within each group. Virus neutralization titre ranges are presented as a heatmap, where for each individual (column) the associated titre is given by colour. Titres from 20 (light orange) to 1280 (dark blue), which is the highest dilution or titre at which the sera are still able to neutralize a fixed amount of the antigen. White spaces indicate no neutralization occurred. Results for H1, H2, H7–H9, H11, H14 are not plotted due to negative results in all individuals in all groups. HA subtypes are plotted by phylogenetic relatedness, illustrated by a cladogram. Results of H3 neutralizations are those using the vaccine strain as antigen. Full virus names for the antigens utilized are listed in Table S1 (Supporting information).
