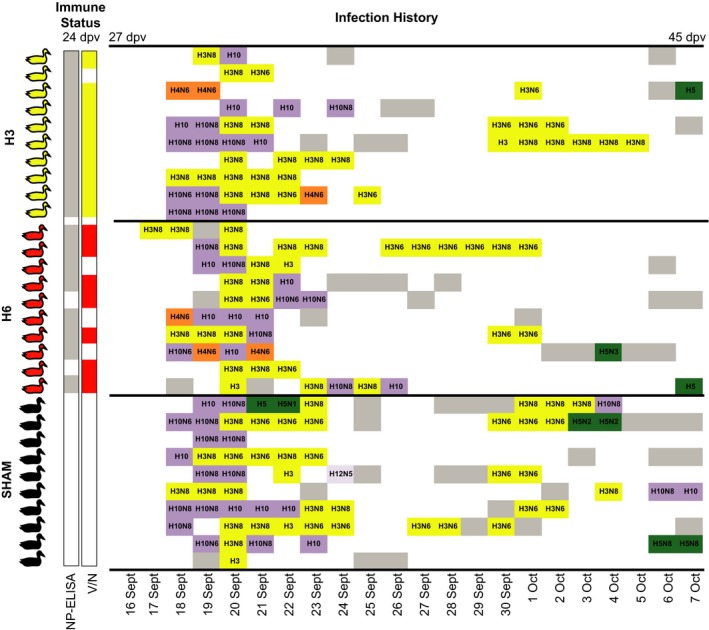
Figure 3.

Immune status prior to being placed in the ducks trap, and infection histories of individuals. Individuals are ordered numerically by ring number within treatment group, vertically. Individuals with anti‐NP antibodies (S/N < 0.5 by NP‐ELISA) (13 September; 24 dpv) are shaded grey in the corresponding column, those with subtype‐specific antibodies (H3 antibodies – H3 group, H6 antibodies – H6 group by virus neutralization) (13 September, 24 dpv) are coloured in the V/N column. Infection histories are the daily infection status for each individual while in the duck trap [ranging from 16 September (27 dpv) to 7 October (45 dpv)]. White space indicates rRT–PCR‐negative samples. Isolates that were subtyped are coloured by HA subtype; samples that were rRT–PCR positive and not successfully isolated are in grey.
