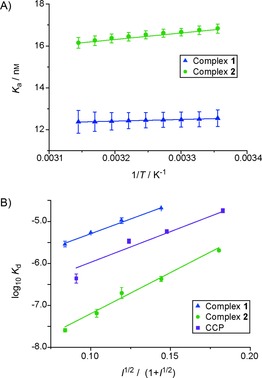
Figure 3.

Van't Hoff and Debye–Hückel analysis on the binding interactions between cyt c and complexes 1 and 2. A) Representative van't Hoff analysis (5 mm sodium phosphate, 0.2 mg mL−1 BSA, pH 7.5), temperature range 25 to 45 °C (errors in curve fitting for a single replicate are shown). B) Debye–Hückel analysis, with use of the Güntelberg approximation (5 mm sodium phosphate, 0.2 mg mL−1 BSA, pH 7.5) and variable concentrations NaCl; variation in K d from two replicates is shown).
