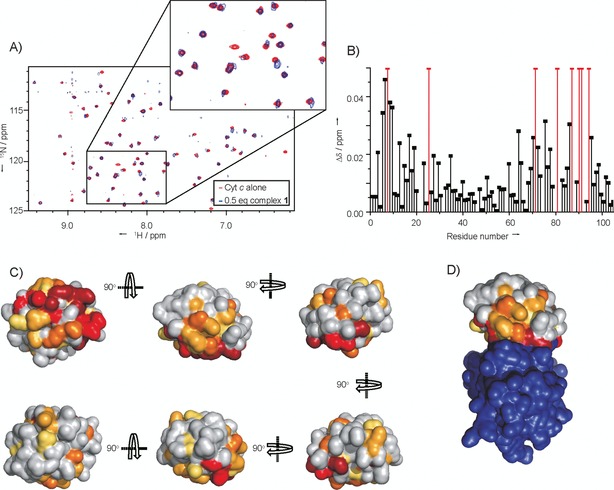
Figure 5.

1H,15N HSQC NMR data for complex 1 binding to cyt c. A) Region of the overlaid HSQC spectra of cyt c (red) and cyt c with 0.5 equiv complex 1 (blue). Inset shows zoom in of part of the spectrum, showing some peaks staying the same, some having shifted and one disappearing. B) 1H,15N chemical shift differences (Δδ) for the different amino acid residues with and without complex 1. Gaps are for proline residues and unassigned amino acids; red bars show amino acids for which the signal disappears due to significant line‐broadening of NH crosspeaks on addition of complex 1. C) Chemical shift perturbation map of cyt c, molecular surface of cyt c generated from PyMol (PDB ID: 1U75),54 with colouring corresponding to the extent of chemical shift changes (Δδ) on addition of the complex. Amino acids with 15N,1H resonances that disappear are shown in dark red, those that exhibit large chemical shift changes (Δδ>0.03) are in red, moderate changes (Δδ>0.02) are in orange, small changes (Δδ>0.015) are in yellow‐orange and very small chemical shift changes (Δδ>0.01) are in yellow. D) Perturbation map of cyt c (as in (C)) in complex with CCP (purple); this view corresponds to that of the central top image in (C) (PDB ID: 1U75).34.
