
Figure 1.
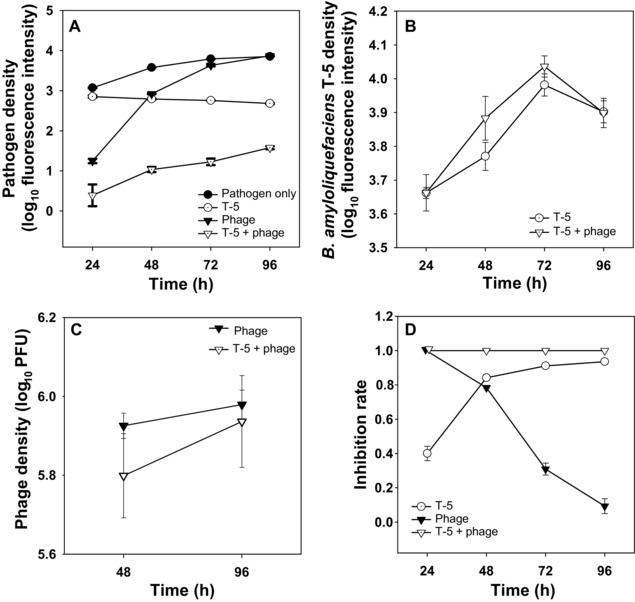
The microbial population dynamics during the short‐term laboratory experiment. The population densities of Ralstonia solanacearum pathogen QL‐RFP (A), B. amyloliquefaciens T‐5‐GFP competitor (B), phage (plaque forming units, i.e. PFU) (C) and the pathogen inhibition rates in different treatments (D). All bars show ± 1 SE.