
Figure 2.
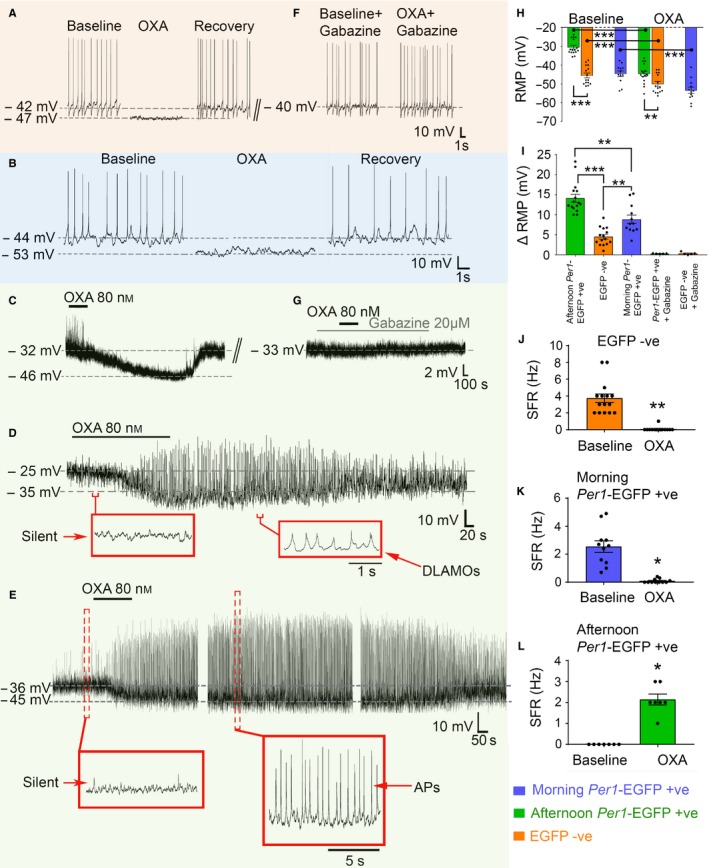
Orexin (OXA) indirectly suppresses the activity of Per1‐EGFP+ve and EGFP−ve SCN neurons. (A) Typical inhibitory response of an SCN EGFP−ve neuron to bath application of OXA during the mid‐afternoon, causing membrane hyperpolarization and complete suppression of AP firing. (B–E) Whole‐cell recordings showing suppressive response of moderately hyperpolarized/excited morning (B) and hyperexcited afternoon (C–E) Per1‐EGFP+ve neurons to bath applied OXA. In morning cells, OXA caused membrane hyperpolarization and suppression of AP firing. In some afternoon cells the OXA‐evoked RMP suppression triggered paradoxical firing of APs (E, 7/16 responsive cells; see L), while in others it elicits DLAMOs activity (D, 4/16 responsive cells). In the remaining OXA responsive neurons (5/16) RMP hyperpolarization did not evoke APs or DLAMOs and the cells remained silent (C). (F–G) Consecutive traces from cells (A) and (C), respectively, showing examples that co‐treatment of cells suppressed by OXA (e.g. A–C) with OXA and the selective GABAA receptor antagonist, gabazine, abolished OXA effects. (H–L) Summary analyses of OXA's effects on excitability of Per1‐EGFP+ve and EGFP−ve neurons, with (H) showing suppression of RMP, which in both populations was significantly different from baseline (12 morning and 16 afternoon Per1‐EGFP+ve, and 15 EGFP−ve cells). (I) The magnitude of this OXA‐evoked change (Δ) in RMP was significantly different when cell‐type and cell‐state were compared; hyperexcited afternoon Per1‐EGFP+ve > moderately resting morning Per1‐EGFP+ve > EGFP−ve neurons. Co‐application of gabazine with OXA prevented Δ in RMP in all cells tested (n = 5 Per1‐EGFP+ve and 5 EGFP−ve cells; single degree of freedom t‐test; P > 0.05). (J–K) In EGFP−ve and morning Per1‐EGFP+ve neurons OXA‐evoked hyperpolarization significantly suppressed firing activity. (L) Quantification of the paradoxically‐elicited spiking activity in Per1‐EGFP+ve cells during OXA‐evoked hyperpolarization. ***P < 0.0001; **P < 0.01; *P < 0.05. Data shown in panels H to L are plotted as mean ± SEM, with data points from individual neurons depicted as filled black circles. [Colour figure can be viewed at wileyonlinelibrary.com].