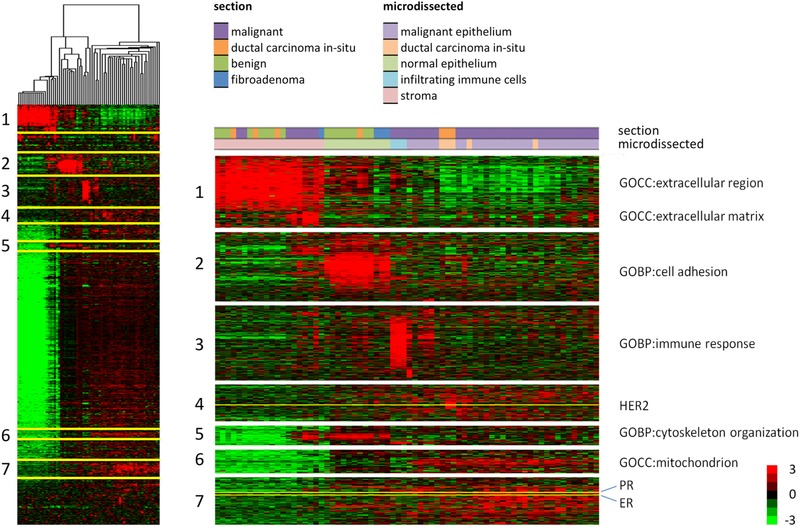
Figure 4.

Heatmap of a cluster analysis based on protein abundances in each microdissected sample. Full cluster analysis and zoomed selected clusters that were strongly enriched in indicated cellular location or biological processes, as well as clusters around the markers ER, PR, and HER2.
