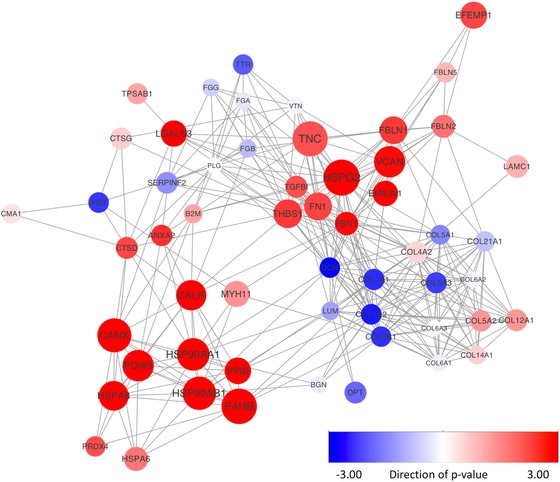
Figure 6.

STRING protein interaction map of ECM organizing proteins detected in microdissected stroma. Selected proteins had a GO biological process annotation that included ECM organization and degradation. Node size corresponds to absolute fold change between stroma and reactive stroma, ranging from log fold change 0 to 5.5. Node color corresponds to change in abundance, with blue lower in reactive stroma and red higher. Color intensity corresponds to the significance (–log p‐value). Downregulated proteins were given a negative sign.
