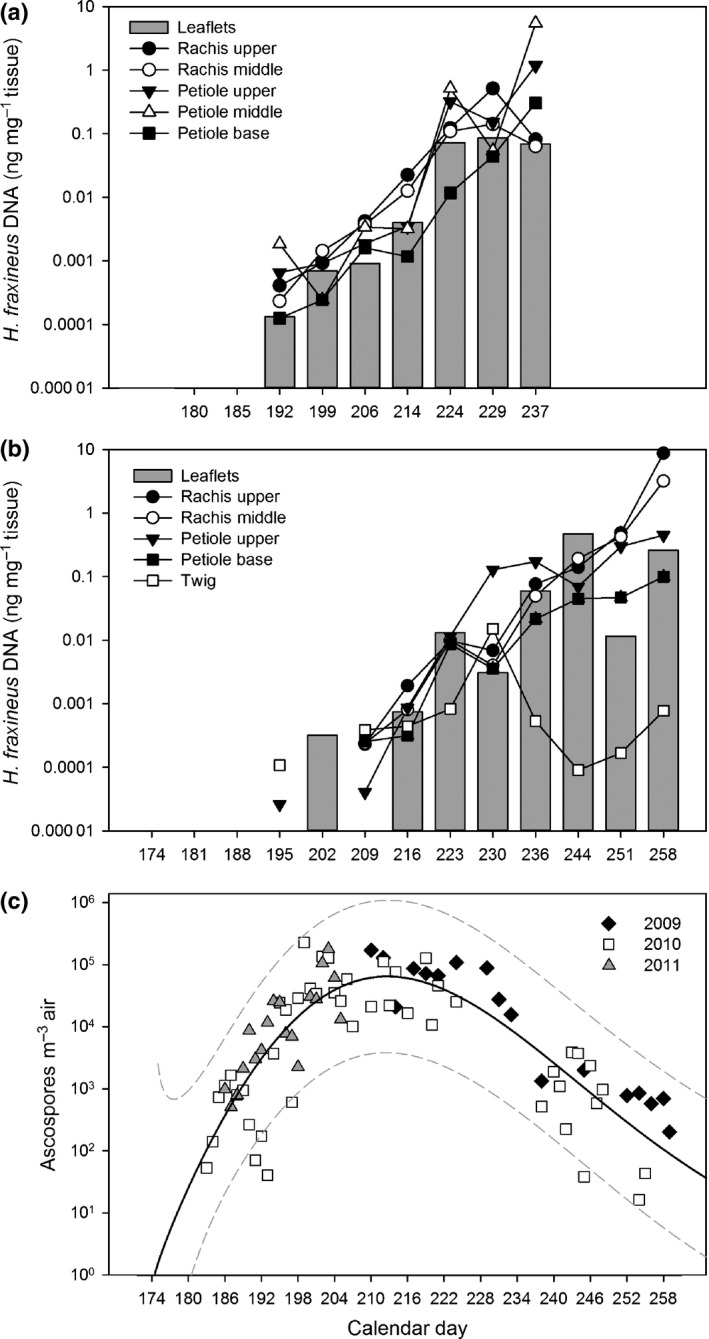
Figure 2.

Hymenoscyphus fraxineus DNA amount in ash tissues (ng DNA mg–1 tissue) sampled throughout the summers of 2011 (a) and 2012 (b), and the amount of airborne pathogen ascospores at the experimental stand during 2009–2011 (c), either analyzed by a real‐time PCR assay specific to the DNA of the fungus or by microscopy (spore data). For leaflet tissues from 2011 and spores, the data are obtained from Hietala et al. (2013). Calendar days with missing values in (a) and (b) indicate that the fungus was not detected. Note that, for spores, the sampling covered only part of the sporulation season in 2009 and 2011. In panel (c) the continuous line indicates a model fitted to the data, while the dashed lines show 95% predictive intervals calculated as described in Supporting Information Methods S1.
