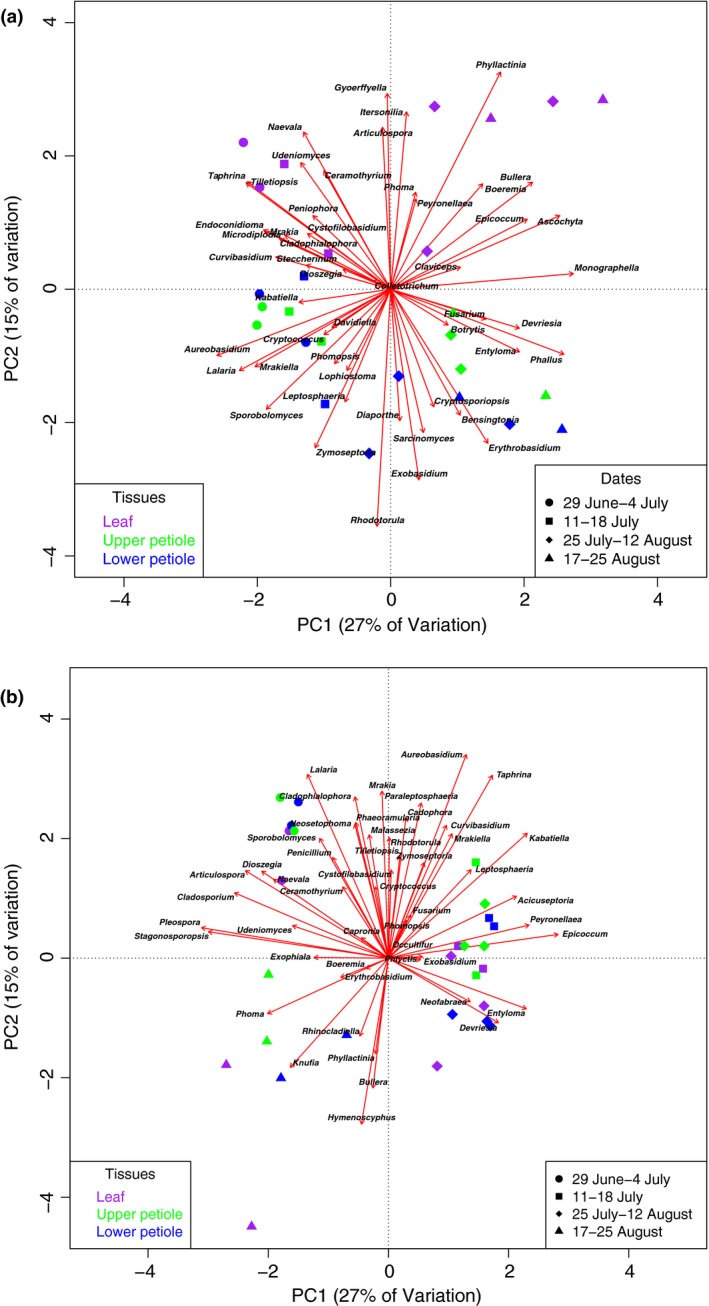
Figure 4.

Principal component analysis (PCA) biplots of 50 most abundant genera of internal transcribed spacer‐1 (ITS‐1) (a) and ITS‐2 (b) datasets. The samples are indicated by symbols and colors, with the symbols corresponding to the time periods (circles, sampling dates 29 June and 4 July; squares, 11 and 18 July; diamonds, 25 July and 2 and 12 August; triangles, 17 and 25 August). Colors indicate the tissue type of each sample (purple for leaf, green for upper petiole, and blue for lower petiole). The placement of generic names indicates the samples with which they are correlated (e.g. Hymenoscyphus is correlated with late season samples in ITS‐2 (b)). The arrows pointing to each genus represent eigenvectors showing the correlation of one taxon to another; genera with a small angle between their vectors are strongly positively correlated, genera with angles at 180° are expected to be strongly negatively correlated, and genera perpendicular to each other (angles of 90 or 270°) are not correlated to each other.
