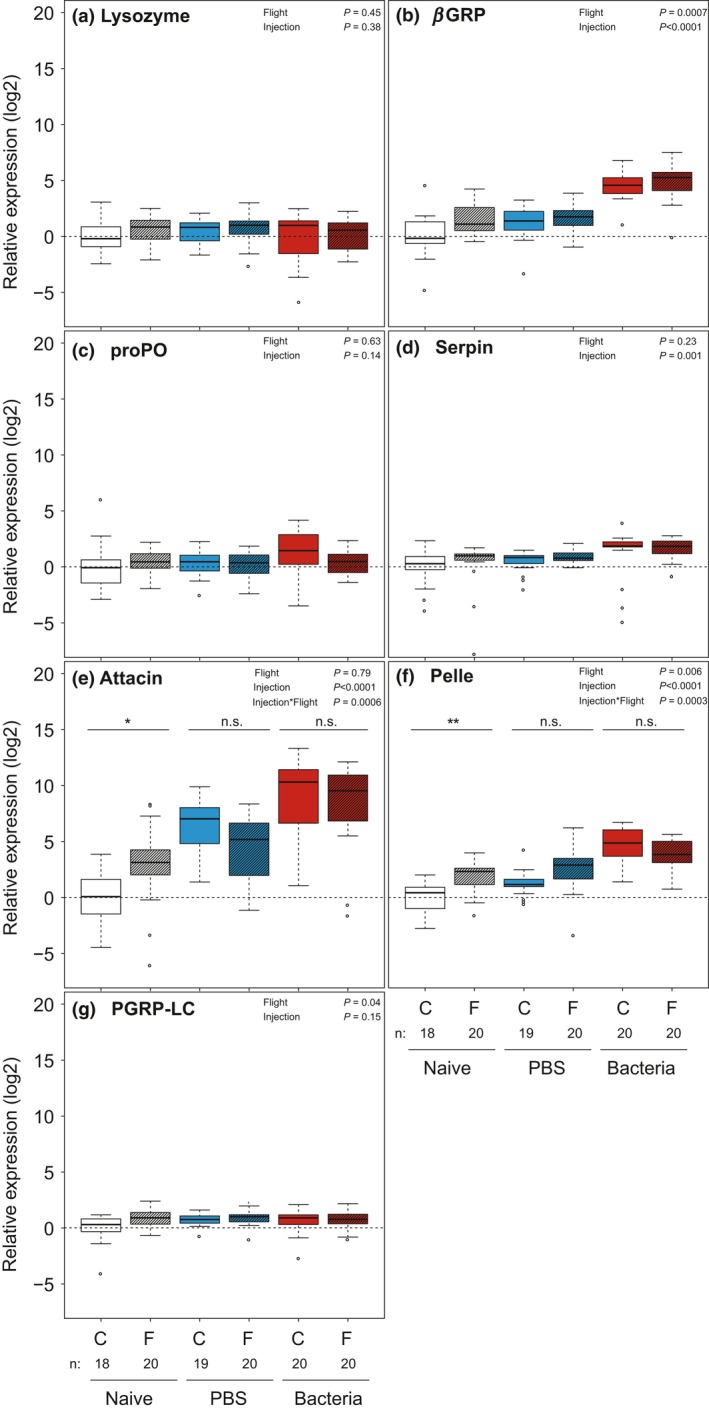
Figure 1.

Immune gene expression in the Glanville fritillary butterfly. Shown are the relative expression levels (log2‐transformed) of the seven tested immune genes of naïve (white), PBS‐injected (blue; wounding with 2 μL PBS) and bacteria‐injected (red; 2 μL of 5‐mg mL−1 Micrococcus luteus in PBS) individuals divided into control (C) and flight (F) treatment groups. Expression levels are calibrated to the naïve individuals that did not experience flight treatment. Sexes are combined, as no sex difference was observed. The P‐values for the effect of flight and immune treatment and their interaction, whenever significant, are presented. The interactions between flight and immune treatment found for attacin and pelle are indicated with asterisks and lines based on the Post hoc test performed.
