Figure 3.

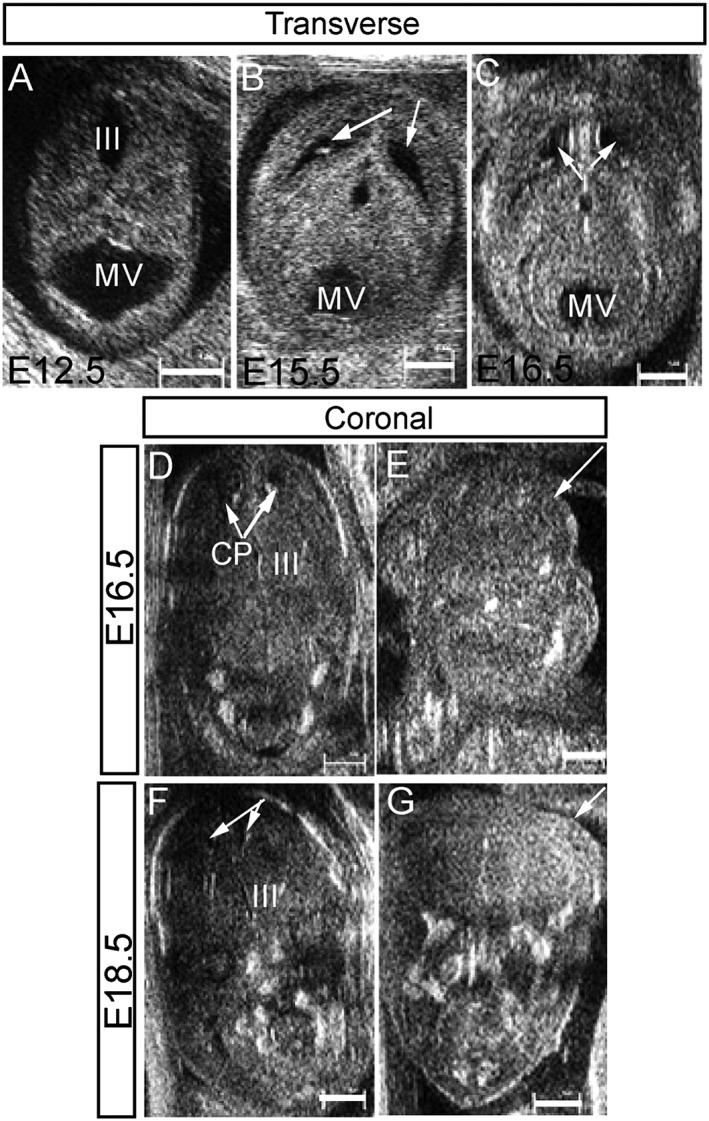
High‐frequency ultrasound imaging of wild‐type and Gldc‐deficient embryos: transverse sections of wild‐type embryos at E12.5 (A), E15.5 (B) and E16.5 (C) show the normal appearance of the mesencephalic vesicle (future aqueduct), the forming cerebral ventricles (arrows) and surrounding brain tissues. Coronal sections through the brain of a wild‐type embryo (D and F) analysed at both E16.5 (D) and E18.5 (F) illustrate the progressive reduction of volume of the body of the lateral ventricles with development. The choroid plexuses (CP) are detectable within the body of the lateral ventricles (arrows in D). The ultrasound appearance of exencephaly in Gldc GT1/GT2 embryos was similar at E16.5 (E) and E18.5 (G); arrows indicate the protrusion of the brain tissues in E and G. (III, third ventricle; scale bar represents 1 mm)
