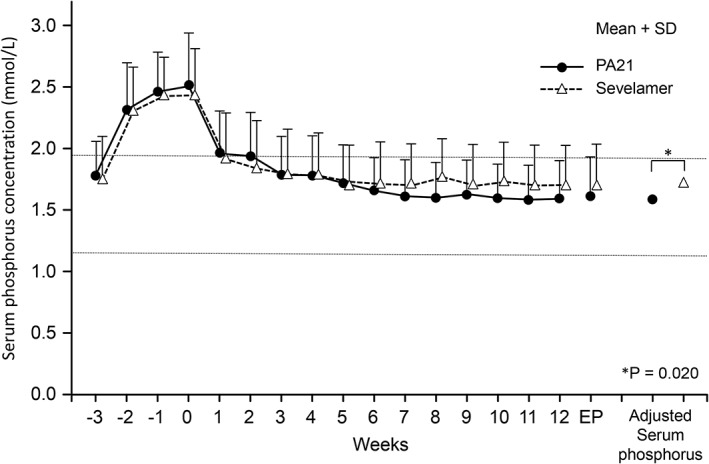
Figure 2.

Serum phosphorus concentrations (mean + SD) (per protocol set). The adjusted mean serum phosphorus concentration at the end of treatment confirmed the non‐inferiority of PA21 (sucroferric oxyhydroxide) to sevelamer (1.62 vs 1.72 mmol/L; difference, −0.11 mmol/L; 95% CI, −0.20 to −0.02 mmol/L; ANCOVA, P = 0.020). A notable decrease in serum phosphorus concentrations was shown at Week 1 in both groups and was maintained until Week 12. The horizontal lines indicate the target range of serum phosphorus concentration in the JSDT guideline. ANCOVA, analysis of covariance; CI, confidence interval; EP, endpoint; SD, standard deviation.
