
Figure 9.
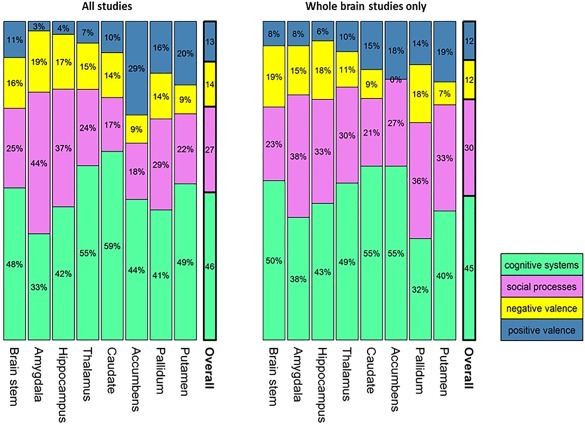
For each region, the contribution of studies that used tasks engaging domains defined by the RDoC project is shown as a proportion of the total number of studies showing case‐control differences in that region. Regional distributions can be compared to the overall RDoC distribution shown in the bars on the right of each figure. [Color figure can be viewed at http://wileyonlinelibrary.com]