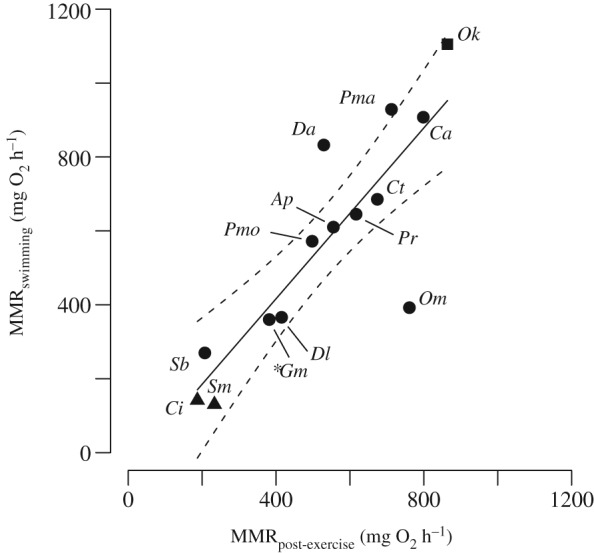
Figure 2.

Scatterplot of fish species for which maximum metabolic rate (MMR) measures (standardized to 1000 g mass and 20° C) were available using both the swimming and post‐exercise respirometry method (ordinary least‐squares regression: y = −46·01 (±119·85 s.e.) + 1·16 (±0·21 s.e.) x; r
2 = 0·72, P < 0·001).  , Regression line and
  , 95% c.i., as well as the abbreviated species identity of each data point: Ap, Acanthochromis polyacanthus; Ca, Chromis atripectoralis; Ci, Ctenopharyngodon idella; Ct, Caesio teres; Da, Dascyllus aruanus; Dl, Dicentrarchus labrax; Gm, Gadus morhua; Ok, Oncorhynchus kisutch; Om, Oncorhynchus mykiss; Pma, Pterocaesio marri; Pmo, Pomacentrus moluccensis; Pr, Poecilia reticulata; Sb, Scolopsis bilineata; Sm, Silurus meridionalis.
  , Benthopelagic species;
  , benthic species (Ctenopharyngodon idella and Silurus meridionalis);
  , pelagic species (Oncorhynchus kisutch). N.B. Multiple MMR estimates were available for G. morhua from which a single mean value was calculated for each method. Literature references for these studies can be found in Table S1 (Supporting Information).
