
Figure 4.
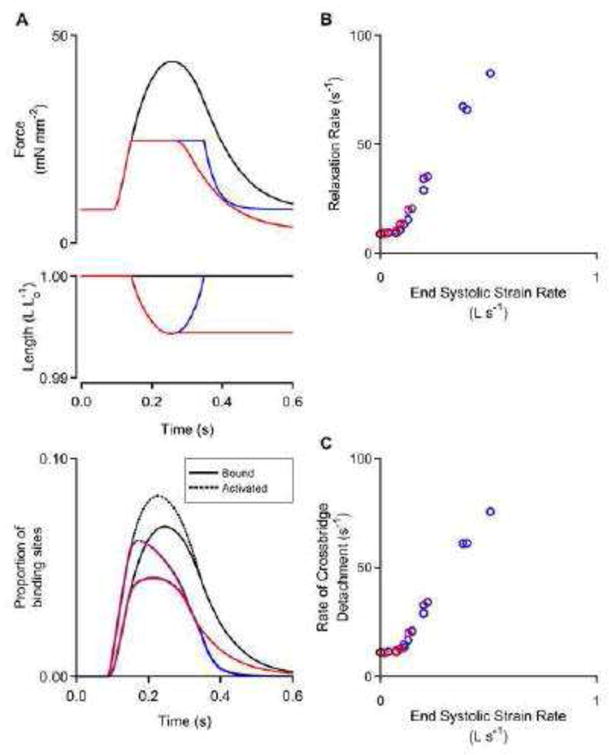
Mathematical modeling reveals molecular mechanisms. A) Model predicted force, length, and acto-myosin binding site status as a function of time. Black: isometric twitch. Red: load-clamped twitch held at minimum length. Blue: load-clamp twitch allowed to fully relengthen before relaxation. B) Relaxation rate versus end systolic strain rate and C) cross-bridge detachment rate versus end systolic strain rate for multiple simulated twitches. This modeling data set shows that cross-bridge detachment rates are slow unless a fast stretch is applied before relaxation.