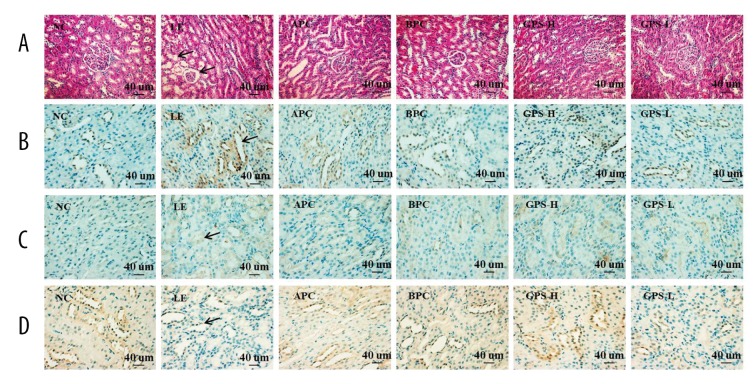
Figure 6.
Histopathological and immunohistochemical findings of URAT1, GLUT9 and OAT1 in rat’s kidney. NC – normal control; LE – Lipid Emulsion contained high cholesterol and high fat food group; APC – Lipid Emulsion with positive control of Allopurinol group; BPC – Lipid Emulsion with positive control Benzobromarone group; GPS-H – Lipid Emulsion with high dose of Gypenosides (60 mg/kg body weight); GPS-L – Lipid Emulsion with low dose of Gypenosides (15 mg/kg body weight). (A) Hematoxylin-eosin stainingof a serial section (original magnification 200×); (B) URAT1 (original magnification 400×); (C) GLUT9 (original magnification 400×); (D) OAT1 (original magnification 400×). GPS improved kidney histopathological changes in the hyperuricemic rats.

