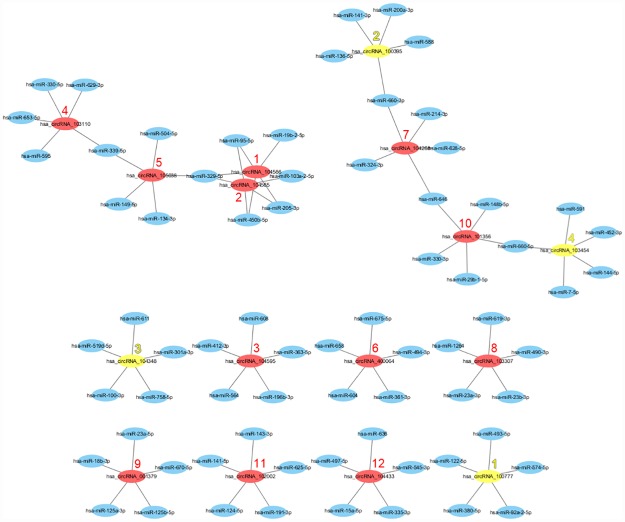
Fig 6. Network map of circRNA-miRNA interactions in PTC tumors.
The network map consists of the previously identified 12 significantly upregulated circRNAs (represented by red nodes) and four significantly downregulated circRNAs (represented by yellow nodes) along with their 56 target miRNAs (represented by blue nodes). The numerical rank of each circRNA fold-change has been annotated next to each circRNA node.

