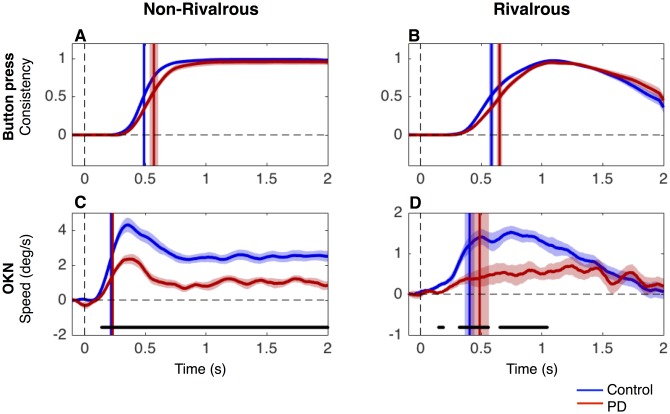
Fig 2. Time course of button press consistency and OKN.
The mean time course of button press consistency (A and B) and velocity of slow-phase OKN (C and D) in non-rivalrous (A and C) and rivalrous (B and D) conditions. The vertical lines denote the latency, defined as the time to reach half of the maximum. Black lines at the bottom (only present for C and D) represent the period of statistical difference between PD and controls (unpaired two-tailed t-test, False Discovery Rate adjusted at q = 0.05, p<0.05). The data for PD patients and controls are shown in red and blue, respectively, and the shaded area (when visible) represents SEM across subjects. Note that y-axis for C and D are on different scales.

