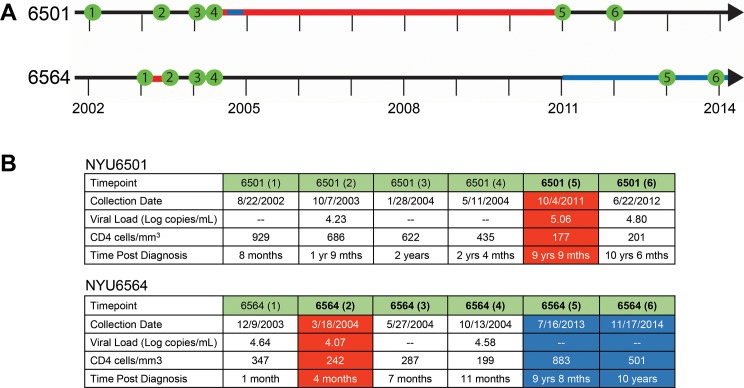
Fig 1. Timeline and clinical parameters of the two cases of intrasubtype CRF02_AG superinfection.
A) Plasma samples were collected from 2002 to 2014 for patients NYU6501 and NYU6564. Samples are shown in green along the timeline. Red indicates the time span when superinfection occurred. Blue indicates antiretroviral treatment (ART). B) Collection dates, viral load, CD4 cell counts, and the time post diagnosis for each sample used in the study (mths abbreviates for months when listed). Red shades indicate the first time point collected after superinfection occurred. Blue shades highlight samples taken when the patient was on ART. Time points after superinfection are in bold.

