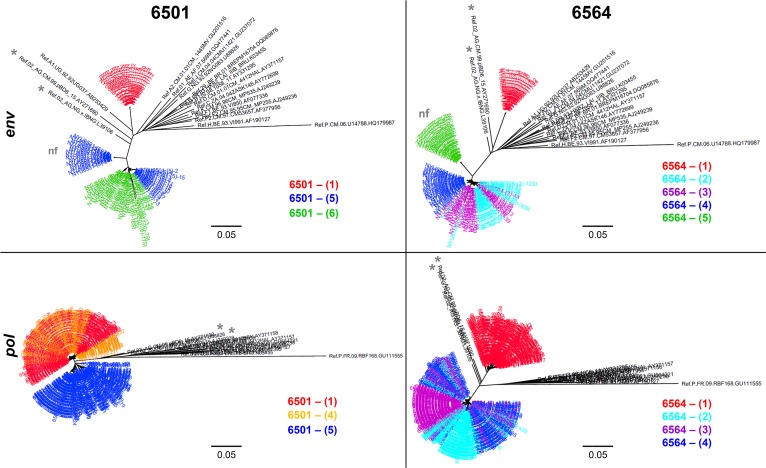
Fig 2. Phylogenetic diversity before and after superinfection in two genomic regions.
Top: Envelope gene analysis for the ~1.6 kb portion (HXB2 6225–7817) for patients NYU6501 and NYU6564. Over 20 clones for at least 3 time points spanning 10 years were analyzed. Red indicates time points before SI. For NYU6501, we obtained both functional and non-functional (nf) env populations at the first time point post-SI (5), of which only the functional sequences evolved to closely cluster with subsequent lineages of time point 6. At the later time point NYU6564-(5), when the patient has undergone ART, we were only able to amplify non-functional (nf) env sequences out of the plasma. Bottom: The pol region was analyzed on the MiSeq platform generating over 40,000 sequences for each time point. Shown here are consensus sequences made from these data for ≥3 time points. Red and orange indicate time points before SI. Phylogenetic trees were generated using MEGA and FigTree software and were created using the indicated reference sequences downloaded from the Los Alamos Database (black). CRF02_AG reference sequences are marked with an asterisk.

