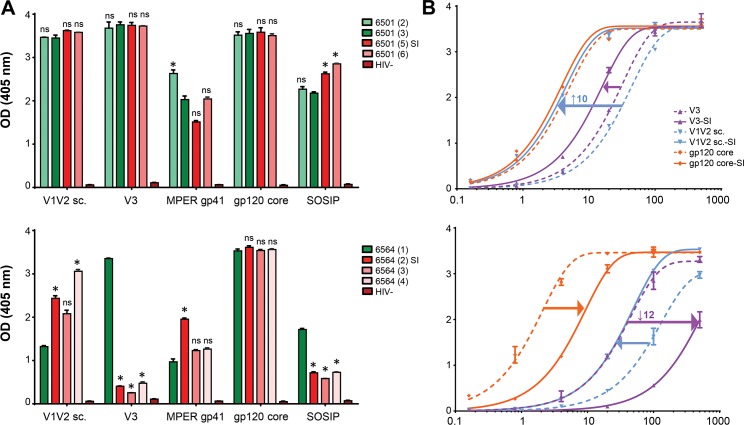
Fig 4. Differential binding patterns to env antigens after intrasubtype superinfection.
A) Plasma samples diluted 1:100 were used in ELISA to observe longitudinal plasma antibody binding to envelope antigens V1V2 sc (scaffolded), V3, MPER gp41, gp120 core, and a SOSIP gp140 trimer. Green colors indicate samples tested pre SI and red colors indicate samples post-SI. One-way ANOVA with repeated measures and a multiple comparisons test was used to determine if the binding changes observed to the time point immediately before superinfection (dark green) were significant. B) Binding curves with plasma purified IgG from one time point before [6501-(3); 6564-(1)] and after SI [6501-(5); 6564-(4)] against selected antigens with >5 fold affinity change observed in at least one individual. Analyzed IgG concentrations range from 500 μg/mL to 0.1 μg/mL. Fold change in relative apparent affinities (EC50) after superinfection are indicated as arrows in the binding curves; highest fold change is indicated with the value (see also S2 Table). Nonlinear regression curves and EC50 values were calculated in GraphPad Prism.

