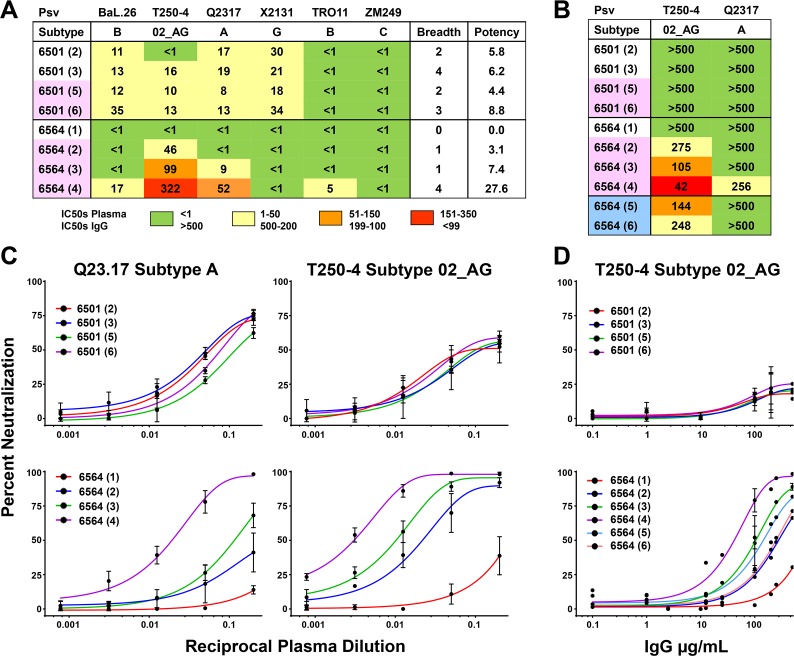
Fig 6. Heterologous neutralization responses in two cases of intrasubtype CRF02_AG superinfection.
A, B) Table of IC50 values that represent the plasma dilutions (A) or IgG concentrations (B) needed for 50% neutralization of the respective pseudovirus. IC50 values were calculated using nonlinear regression fits of the neutralization curves in GraphPad Prism and are illustrated in a color-coded scheme. Resistance to neutralization was assumed if the plasma or IgG sample could not reach 50% neutralization at the lowest plasma dilution (<1) or highest IgG concentration (>500 μg/mL), respectively, and is indicated in the table with a green shade. Breadth and potency values were calculated as described previously [10]. Pseudoviruses are all tier 2 covering subtypes A, B, C, G, and CRF02_AG, with the exception of lab strain BaL.26, tier 1, subtype B. MLV was tested as negative control and to ensure absence of ART (S9 Fig). Time points filled in with pale red are after superinfection, pale blue after initiation of ART. IC50, breadth, and potency values are calculated using the averages of 2 or more experiments. C) Neutralization curves from plasma samples for NYU6501 & NYU6564 against pseudoviruses T250-4 and Q23.17, shown as the percent neutralization at the reciprocal plasma dilution. D) Neutralization curves from IgG samples for NYU6501 and NYU6564 against pseudoviruses T250-4, shown as the percent neutralization at the given IgG concentration.

