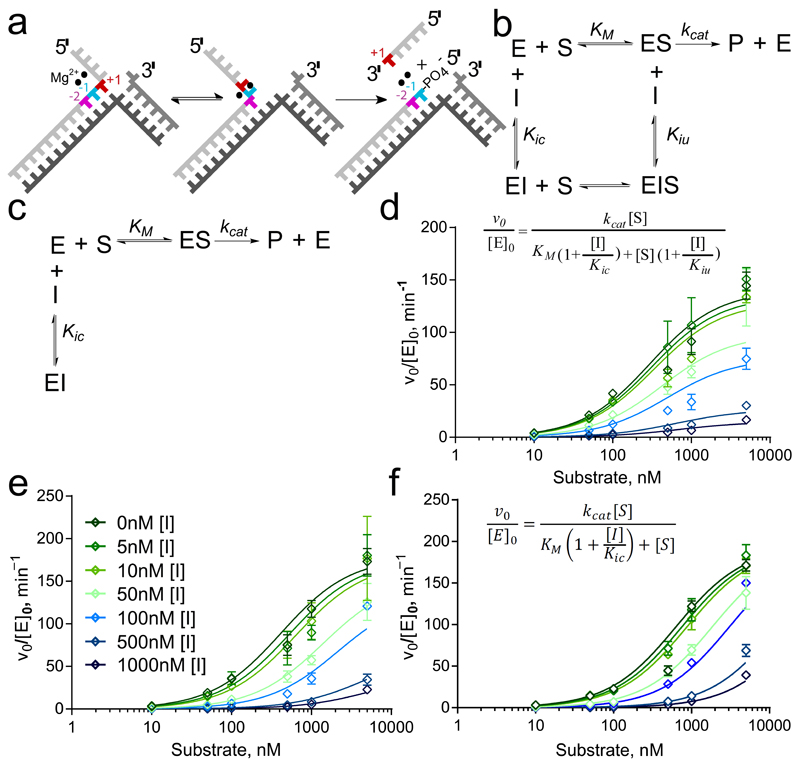
Figure 2. Differences in inhibition characteristics of the compounds.
(a) hFEN1-catalyzed reaction schematic showing double nucleotide unpairing at positions +1 and −1 (numbering relative to scissile phosphate). (b,c) Reaction schemes of mixed inhibition (b) and competitive inhibition (c) models. In each case, E, S, I and P represent enzyme, substrate, inhibitor and product, respectively. Kic is the dissociation constant of I from free enzyme (competitive with substrate) and Kiu is the dissociation constant of I from ES complex (uncompetitive). (d–f) Nonlinear regression plots of normalized initial rates of reaction vs. substrate concentration (open diamonds) for substrate DF1 at varying concentrations of compounds 1 (d; inset shows equation for mixed inhibition model), 2 (e; inset shows legend correlating color/symbol to inhibitor concentration) and 4 (f; inset shows equation for competitive inhibition model). Error bars represent standard errors from global fitting of combined data from two triplicate experiments (fits to alternative models are shown in Supplementary Figures S7–S9).

