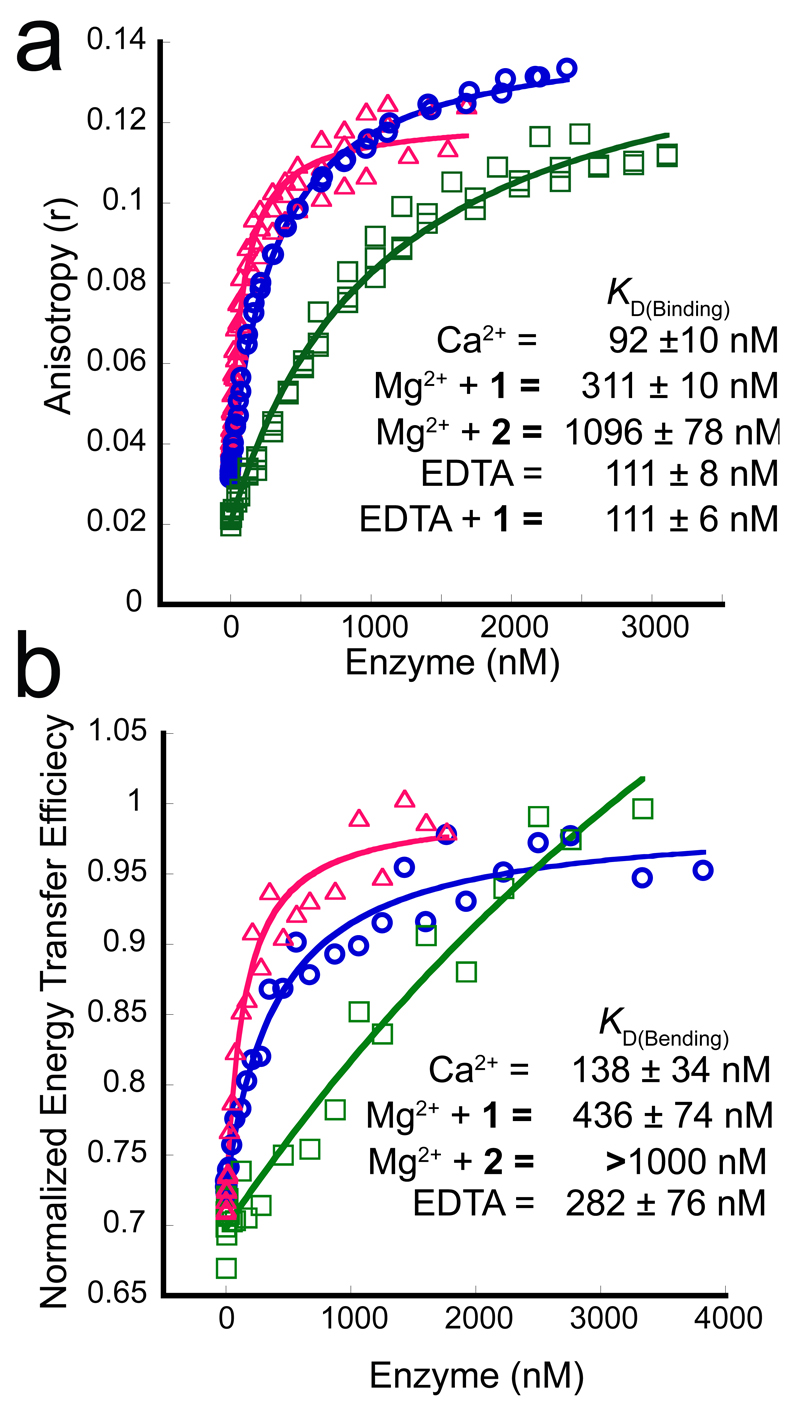
Figure 3. Effect of inhibitors on substrate binding assessed by fluorescence anisotropy (FA) and FRET.
(a) Typical FA titration data for hFEN1-R100A binding DF1 in the presence of 10 mM Ca2+ (magenta, open triangles), 8 mM Mg2+ plus 100 μM compound 1 (blue, open circles) or 8 mM Mg2+ with 100 μM compound 2 (green, open squares); three independent titrations were carried out for all FA binding experiments. (b) Representative curves of typical normalized FRET binding data for DF1 and hFEN1-R100A. Experiments were conducted in triplicate, but only one data set and curve is shown here for each titration. Colours and symbols for each of the three plots are the same as in panel (a).

