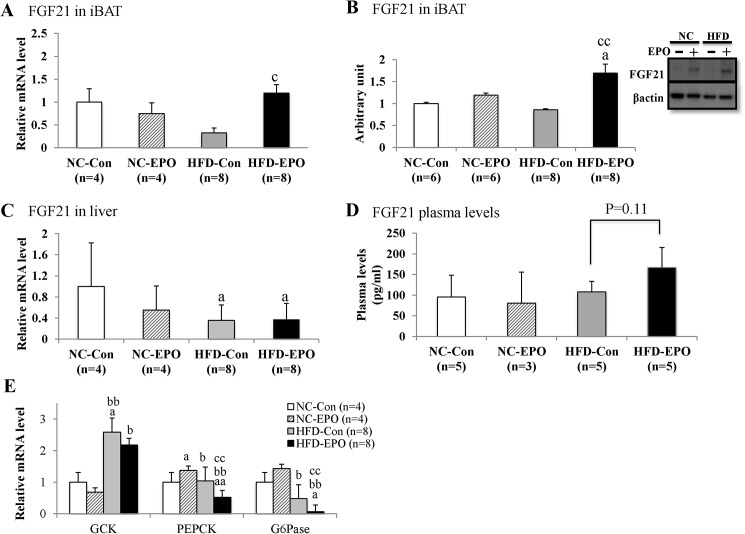
Fig 10. Effect of erythropoietin (EPO) on expression/secretion of FGF21 in interscapular BAT (iBAT) and the liver and gluconeogenesis-related genes in the liver.
(A) Real-time PCR experiments in iBAT. (B) Western blot analysis. (C) Real-time PCR experiments in liver tissue. (D) Plasma levels of FGF21. (E) Real-time PCR experiments in liver tissue. Values given are mean ± SE for 3–8 mice. aP < 0.05 or aaP < 0.01, vs. mice fed normal chow diet (NC-Con). bP < 0.05 or bbP < 0.01, vs. mice fed normal chow diet plus EPO (NC-EPO). cP < 0.05 or ccP < 0.01, vs. mice fed a high-fat diet alone (HFD-Con).

