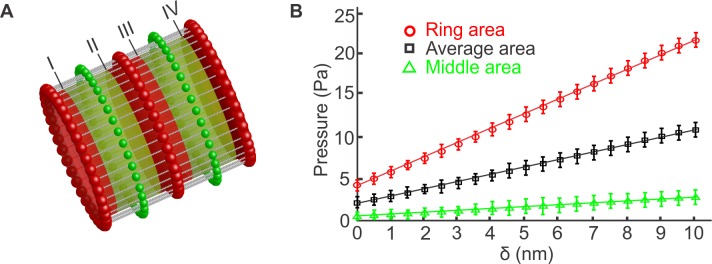
Fig 3. Measurement of the axon plasma membrane Young’s modulus.
(A) We expand the radius of the axon by 10 nm, in sequential steps of 0.5 nm, by applying a cylindrical Lennard-Jones potential with equilibrium distance measured from the center-line of the axon. At each radius, we measure the total force applied on all the membrane skeleton particles that belong (i) to stripes of 80 nm diameter around the actin rings (red stripes), (ii) to stripes of 105 nm diameter located between actin rings (green stripes), and (iii) to the entire membrane skeleton along the axon. By dividing the total force with the corresponding total area, we compute the pressure on the region between actin rings, on the region around the actin rings and the average pressure on the entire membrane skeleton. Every 0.5 nm increase occurs in 1000 time steps. At each radius, the system is equilibrated for another 1000 time steps while the actual measurements occur every time step for 8000 time steps. Labels I-IV indicate the boundaries of the areas on which we measure the pressure. (B) The mean pressure values obtained for each stripe type are plotted vs the corresponding radii values. From the slope of the fitted straight line and using the linear elastic cylindrical shell theory, the Young’s moduli for each region and the average value are computed. The probability distributions of the pressures measured for the two stripes and for the entire membrane skeleton at 1.5 nm radius are shown in S16 Fig.

