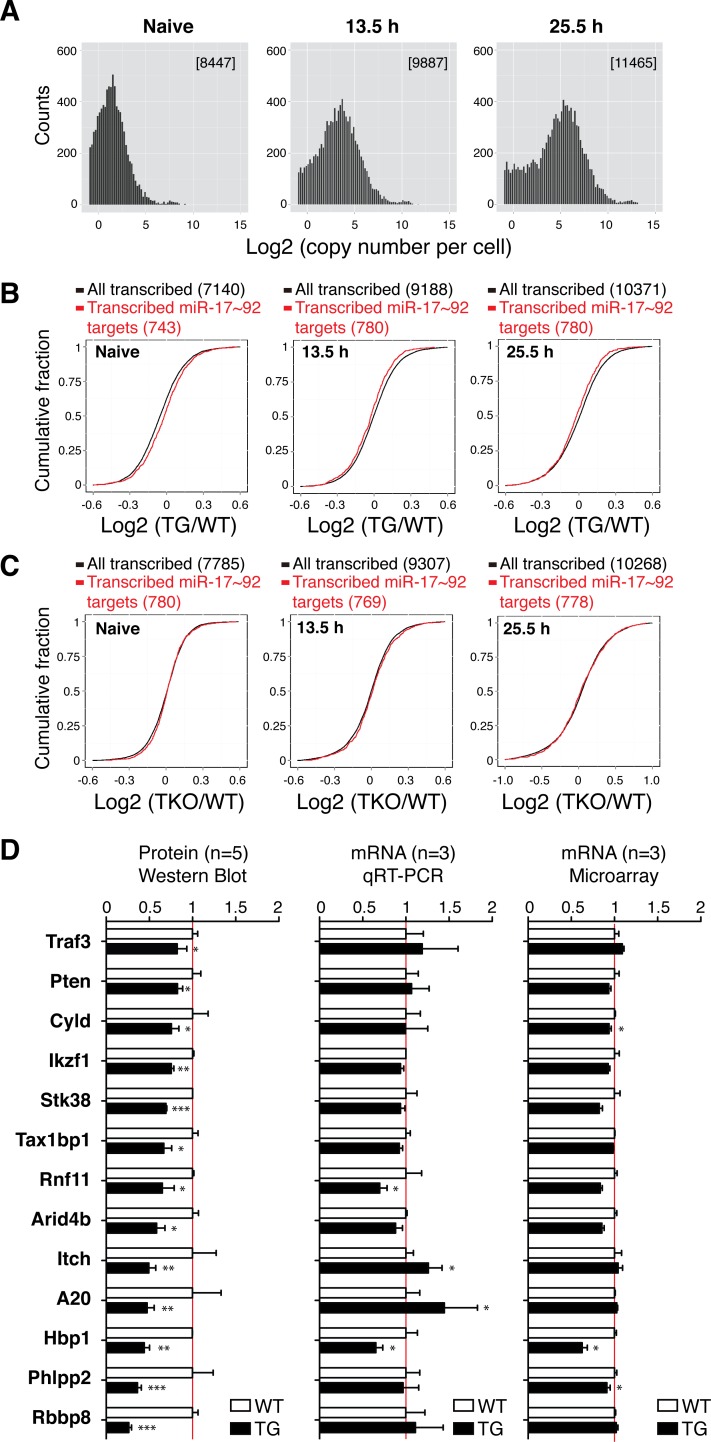
Fig 1. The impact of miR-17~92 on target gene mRNA and protein levels.
(A) The distribution of mRNA abundance in naïve and activated B cells as determined by ERCC-RNA-seq analysis. Numbers in parenthesis represent the number of unique genes significantly transcribed (greater than 0.5 copy per cell). Y-axis (counts) indicates the number of genes of a given abundance (X-axis, bin size = 0.2). (B,C) Microarray analysis of TKO, WT, and TG B cells. Numbers in parenthesis indicate the numbers of transcribed genes and transcribed miR-17~92 targets analyzed by microarray. (D) The protein and mRNA levels of 13 target genes showing reduced protein levels in 25.5h activated TG B cells as determined by Immunoblot (n = 5). mRNA levels were determined by qRT-PCR and microarray (n = 3). Target gene expression levels were normalized to β-Actin, and their relative expression in WT naïve B cells was arbitrarily set as 1.0.

